Food Prices Increase in July but Energy Prices Decrease
Higher food prices in July were reflected in grocery bills. Food at home prices increased 0.3 percent led by meats, poultry, fish, and eggs (+0.4 percent), dairy products (+0.3 percent), and cereals and bakery products (+0.4 percent) while summertime vegetable prices declined (-0.5 percent). The price of uncooked beef and veal increased (+1.9 percent) but the price of bacon decreased (-1.7 percent). As for dairy products, the price of whole milk increased (+0.2 percent) but the price of ice cream declined (-1.4 percent). Grocery cart staples such as pasta (+1.2 percent) and bread (+0.8 percent) increased. Restraining overall food prices, both frozen vegetables and canned fruit declined.
Despite the fact that summer driving season is in full swing, motor fuel prices decreased (-1.5 percent) in July. No matter what type of fuel your vehicle takes there was relief at the pump. Regular (-1.6 percent), mid-grade (-1.7 percent), premium (-1.0 percent), and diesel (-0.5 percent) all decreased. Lower fuel prices result in more driving and more oil changes and more wear on cars. Despite the across-the-board-decrease in motor fuel prices, the price of public transportation increased (+0.4 percent). Other energy price changes in July included propane and firewood (+1.2 percent) pinching summertime campfires and grilling.
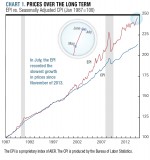
Looking back over the last 12 months both food at home prices (+2.5 percent) and food away from home prices (+2.4 percent) have increased. Over the last 12 months, food at home prices were led higher by butter (+16.5 percent), pork chops (+10.4 percent), cheese (+7.1 percent), and citrus fruits (+7.8 percent). As for energy prices over the last 12 months, motor fuel has increased modestly (+0.8 percent) but natural gas for households recorded a strong increase (+6.9 percent). In recent months, year-over-year price changes as measured by the EPI and the CPI have increased. However, overall price trends remain tame around 2 percent.
About the EPI
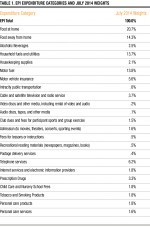
AIER’s Everyday Price Index (EPI) measures the changing prices of frequently purchased items like food and utilities. We do this by selecting the prices of goods and services from the thousands collected monthly by the Bureau of Labor Statistics in computing its Consumer Price Index. The EPI basket contains only prices of goods and services that Americans typically buy at least once a month, excluding contractually fixed purchases such as mortgages. Our staff economists weight each EPI category in proportion to its share of Americans’ average monthly expenditures. In order to better reflect the out-of-pocket prices that consumers experience on a daily basis, the EPI does not seasonally adjust prices.
To learn more about our methodology, view the weights assigned to each component, and browse past EPI updates, visit AIER’s EPI Methodology page.


