February Business Conditions Monthly


AIER’s Business Cycle Conditions Leading Indicators index fell to a reading of 88 in January, slightly below the three-year high of 92 recorded for November and December. The Roughly Coincident Indicators index pulled back to 92 after two months at 100, while the Lagging Indicators index improved to 58 after dipping to 42 in December (see chart below). Both the Leading Indicators index and the Roughly Coincident Indicators index are holding at very high levels, consistent with ongoing expansion and a low probability of recession in the months ahead.
Economic data suggest solid momentum for the economy. However, financial- market volatility in early February has raised some concerns. The combination of improving economic growth (which some believe could lead to a more aggressive Fed), extraordinary gains in equity markets over the past several quarters, and an extended period of unusually low volatility set the stage for sudden and sharp market declines. In general, short-term volatility in financial markets should be ignored and focus should remain on economic and market fundamentals.
Leading indicators dip but remain strong
The AIER Leading Indicators index has been at or above 75 for 14 consecutive months and at or above the neutral 50 level for 96 of the past 101 months. Even with the slight decline in the latest month, the three-month average is 90.3, the highest reading since January 2014. Over the three cycles since 1985, a 3-month-average Leading Indicators index reading above 90 occurred at least 9 months before the next recession and an average of 42 months prior.
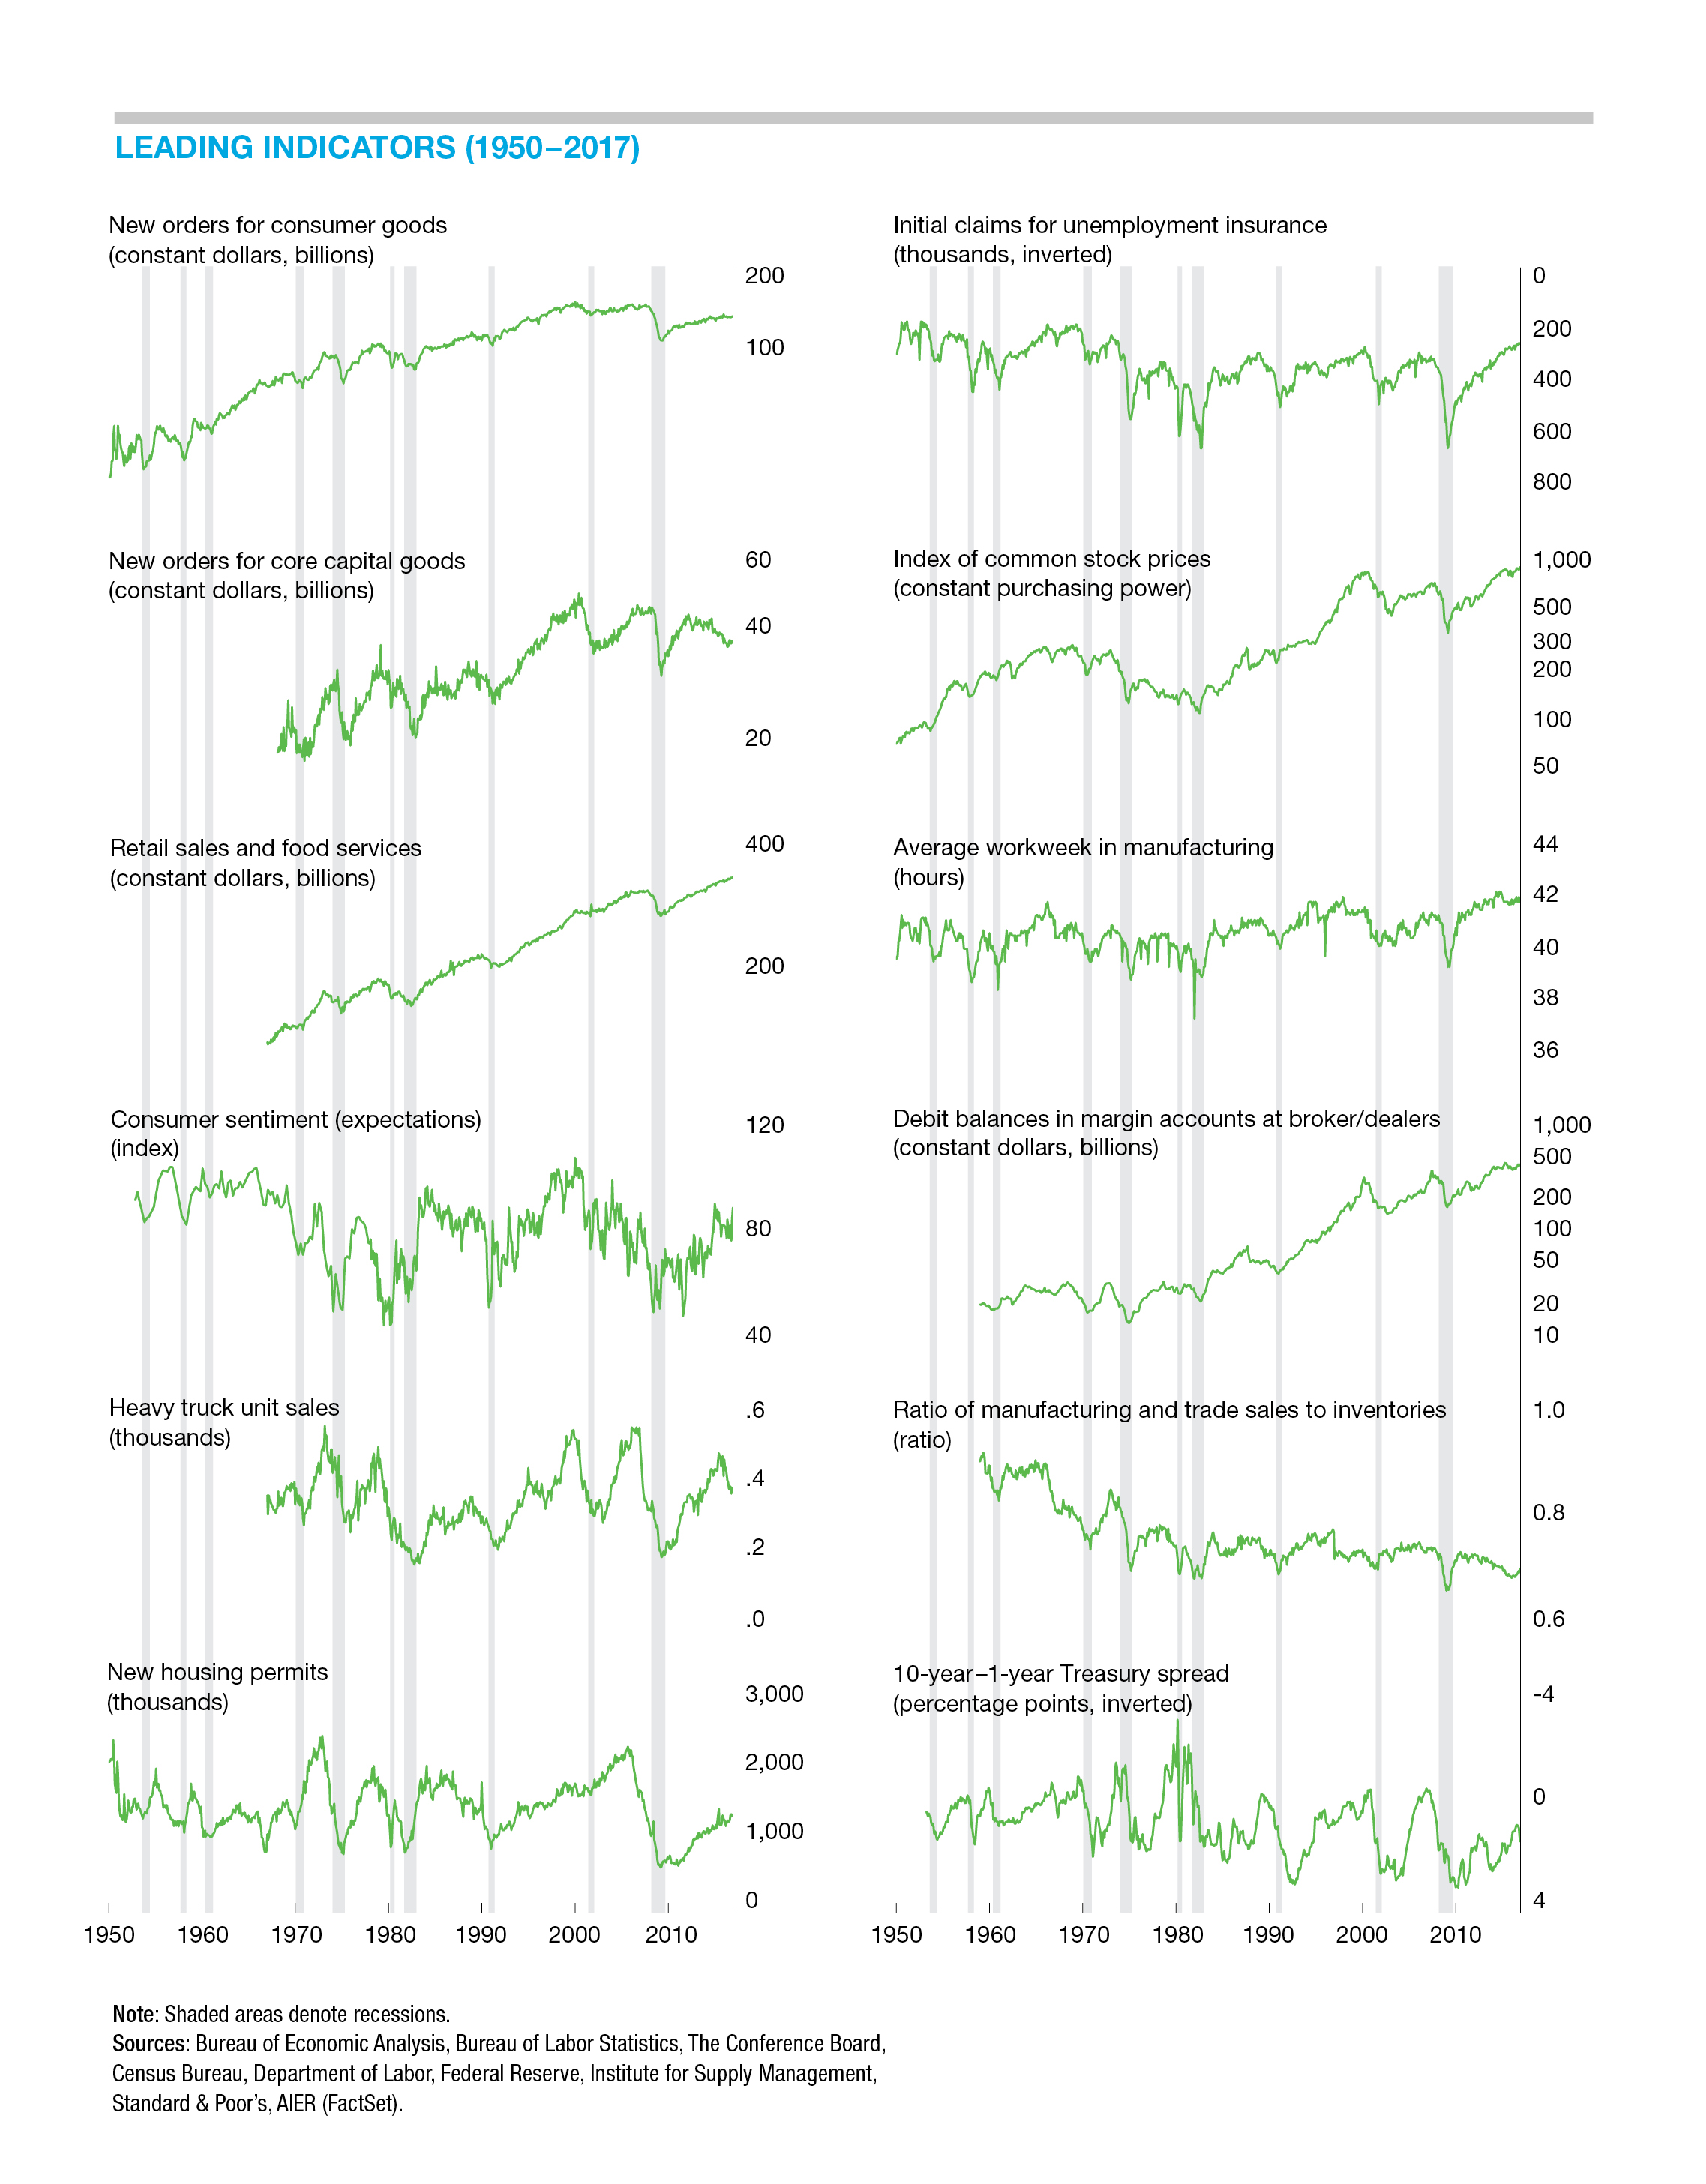
Two of the leading indicators changed signals in January, leaving 10 indicators expanding while 1 was neutral and 1 declining, compared to 10 rising, 2 neutral, and none declining in the prior month. The average workweek in manufacturing dropped from a positive trend to a negative trend. This indicator hit an all-time high of 42.2 in 2014 and then pulled back during the economic slowdown of 2015. It regained some of the loss as the economy rebounded, hitting 42.0 in mid- 2017. The current reading of 41.7 indicates a downtrend from the 42.0 reading in mid-2017 and generates a negative signal in the model. However, as noted last month in the analysis of the of initial-claims indicator, the natural bound for the length of the workweek limits the ability of this indicator to stay in a positive trend indefinitely. It is very important to recognize that the average workweek is still quite long by historical measures, reflecting the renaissance in U.S. manufacturing in recent years. Further declines would make the negative trend more concerning, but for now, it may just reflect the transition to a sustained sideways trend.
Real new orders for consumer goods turned to a positive signal in the latest month. This leading indicator has been neutral for quite some time despite solid growth in consumer spending. Strong support for consumer spending from a tight labor market and solid income growth suggest a positive outlook for this indicator in the months ahead.
The Coincident Indicators index dropped to 92 in January after two months at a perfect 100 reading. The index has hit the 100 mark 9 times in the past 11 months, falling to 92 last month and in October 2017. The 7-month run of perfect readings between March 2017 and September 2017 was the longest run since a string of 40 consecutive 100s from January 2012 through April 2015. Five of the six coincident indicators trended higher in January while one, the employment-population ratio, fell to neutral.
AIER’s Lagging Indicators index rebounded to 58 in January from 42 in December. Overall, three indicators are trending higher, two are trending lower, and one indicator is neutral. The Lagging Indicators index is likely to show further improvement over the coming months given the solid performance of the Coincident Indicators index.
2017 in review: part 2
Real gross domestic product (GDP) rose 2.6 percent in the fourth quarter of 2017, according to the first estimate from the Bureau of Economic Analysis. The gain follows increases of 3.2 percent, 3.2 percent, and 1.2 percent for the prior three quarters. Measured from fourth quarter of 2016 to fourth quarter of 2017, the economy expanded at a 2.5 percent pace, the fastest since back-to-back gains of 2.7 percent in 2013 and 2014.
Gains were widespread among the major components of GDP. Personal consumption expenditures rose 2.8 percent from a year ago, led by a 7.4 percent increase in durable-goods spending. Nondurable-goods spending rose 3.2 percent while services gained 1.9 percent.
Nonresidential fixed investment rose 6.3 percent, led by an 8.8 percent jump in equipment spending, the fastest pace since a 13.1 percent rise in 2011. Nonresidential-structure spending rose 3.7 percent while investment in intellectual property products gained 4.8 percent. Residential investment rose at a 2.3 percent pace, making for the seventh straight year of gain following the housing bubble and collapse.
Combined, these major components make up private domestic demand. Together, that aggregate rose a healthy 3.3 percent in 2017, the third-fastest pace behind a 4.1 percent rise in 2014 and a 3.5 percent gain in 2010.
Among the remaining components of GDP, real exports posted a 4.9 percent rise in 2017 while imports (a negative for GDP) increased 4.6 percent. Combining the two, net exports subtracted about 0.18 percentage points from real GDP growth in 2017.
The government sector increased spending by 0.7 percent for the year as the federal government rose by 1.1 percent and state and local government reduced spending by 0.8 percent.
Price increases remain moderate as money and credit growth decelerates
Prices of personal consumption expenditures (PCE), the benchmark preferred by the Fed, rose 1.7 percent in the fourth quarter of 2017 over the fourth quarter of 2016. That is up just slightly from the 1.6 percent pace from the fourth quarter of 2015 to the fourth quarter of 2016. By this measure, price increases have been below the Fed’s 2 percent target in 9 of the past 10 years.
The core PCE price index, which excludes volatile food and energy prices, rose 1.5 percent in 2017. An alternative measure, the market-based PCE price index excluding food and energy, is up just 1.2 percent over the past four quarters. (Market-based indexes include only goods and services with observable prices and exclude imputed transactions—those furnished without payment—such as certain financial services.) This measure has been below 2 percent for 9 consecutive years and for 14 of the past 18 years.
Money supply, as measured by the 13-week-average M2 aggregate, has grown at a 3.3 percent annualized rate over the last 3 months, below the 4.6 percent pace over the 12 months ending in January 22, 2018. Over the last 20 years, M2 has grown at an average rate of 6.4 percent.
Bank lending rose 2.4 percent in December and is up just 3.7 percent over the past year. Among the major segments, commercial real estate loan growth led the way with 5.8 percent growth over the past year. That pace has been decelerating since peaking at 11.6 percent growth in the middle of 2016. Consumer-loans growth was second among the major components, rising 5.2 percent from a year ago. That pace has been picking up since hitting a low in August 2017. Residential real estate loans grew 1.8 percent from a year ago and have been the slowest- growing segment over the past four years. Commercial and industrial loans rose just 1.1 percent over the past year after leading all the other segments over the four-plus-year run from the middle of 2011 through 2015. Overall, bank-credit growth is running substantially below the 6.1 percent annualized pace since 1985.
Capital markets
As of February 5, U.S. equity markets had tumbled about 8 percent from the January 26 high, a period of just seven trading days. That drop follows a rise of more than 300 percent since the low in 2009. The sharp decline has kicked off the typical firestorm of commentary, much of which is probably useless.
For more than 60 years, AIER has studied business cycles and financial markets. Among the most important conclusions are that the relationship between the economy and financial markets is undeniable, the stock market is a leading indicator for the U.S. economy (the real stock-price index is one of the 12 indicators in the AIER Leading Indicators index), and the stock market is sometimes wrong.
Since 1985, the real stock-price indicator in the business cycle model has turned negative seven times. Four of those signals were incorrect. No indicator is perfect. That is why the Leading Indicators index uses 12 different indicators. The basic rule of thumb is that the risk of recession increases when at least half of the 12 indicators turn negative (the composite index drops below 50). In the most recent update, 10 of the 12 leading indicators in the model, including real stock prices, were still showing a positive signal. The stock-price indicator certainly could change its signal in the next update, but the majority of the indicators remain solidly positive.
Beyond the 12 indicators in the Leading Indicators index, the preponderance of economic data continue to suggest solid economic growth. The Institute for Supply Management (ISM) Purchasing Managers Index, a broad measure of activity for the manufacturing sector, came in at 59.1 in January, where 50 is neutral and readings above 50 suggest expansion. Both the new-orders and production indexes in the ISM report had readings above 60 in January, very strong results by historical comparison. The ISM Nonmanufacturing Index, a similar broad measure of activity for the services sector of the economy, came in at 59.9 in January, also a strong reading. The new-orders and business-activity indexes came in at 62.7 and 59.8, respectively. The average of the two new-orders indexes came in at 64, the highest reading since 2004.
The latest readings on the labor market remain very strong as well. U.S. nonfarm payrolls added 200,000 jobs in January, the third monthly gain at or above 200,000 in the last four months. Since the beginning of 2011, private payrolls have added an average of 200,000 per month, helping drive the unemployment rate down to 4.1 percent and helping boost wage growth to 2.9 percent, the highest rate since 2009. Initial claims for unemployment insurance are near record lows and the number of open jobs nationwide stands at 5.8 million. The strong labor market has helped boost consumer confidence and support income growth and consumer spending.
Overall, the economy appears very solid. The rising concern for investors may be the possibility that the economy is getting too strong and will require more aggressive Fed policy action, which could then slow the economy and profits growth and possibly cause a recession. There is historical precedent for such a scenario; however, for the moment, the Fed appears likely to maintain a slow pace of policy tightening. History also suggests the best course of action is to remain committed to sound investing principles and monitor developments in the economy carefully.
[pdf-embedder url=”https://www.aier.org/wp-content/uploads/2018/02/BCM_February_2018.pdf“]Robert Hughes

Robert Hughes joined AIER in 2013 following more than 25 years in economic and financial markets research on Wall Street. Bob was formerly the head of Global Equity Strategy for Brown Brothers Harriman, where he developed equity investment strategy combining top-down macro analysis with bottom-up fundamentals. Prior to BBH, Bob was a Senior Equity Strategist for State Street Global Markets, Senior Economic Strategist with Prudential Equity Group and Senior Economist and Financial Markets Analyst for Citicorp Investment Services. Bob has a MA in economics from Fordham University and a BS in business from Lehigh University.


