Everyday Prices Stay Steady
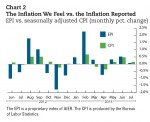
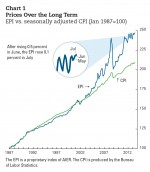
Charts 1 and 2 offer long-term and month-by-month comparisons of the EPI and CPI.
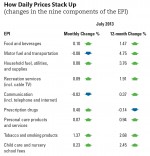
Food and beverages, which make up 38 percent of the typical American’s everyday expenses, increased 0.1 percent in July. Prices of food away from home rose 0.2 percent, contributing 63 percent of this uptick.
Food away from home has been increasing modestly for the past 12 months. Year-over-year July prices were up 2.1 percent. Year-over-year July prices for the entire food and beverage category were up 1.5 percent.
World prices for grains, soy, and palm oil fell as did sugar, meat, and dairy products. The lingering drought in the Southwest has caused producers to increase beef production and will likely keep the price of beef down for a while.
Household fuel and utilities, which comprise 15.4 percent of an American’s everyday expenses, increased 0.1 percent in July. The increase of household fuels and utilities bills offset a 0.6 percent decrease of housekeeping supplies prices.
Electricity bills have kept trending up this year, as industrial production has consistently risen. Electricity bills will likely continue to increase as the economy continues to pick up.
Price increases for natural gas slowed in June, and natural gas actually dropped 1.2 percent in July. The decline is a response to increased production, which will likely modify the upward pressure on the price of natural gas in 2014.
Motor fuel and transportation prices, which make up one-fifth of an American’s everyday expenses, shrank by 0.1 percent in July. Motor fuel prices decreased 0.4 percent last month. (Partially offsetting this was the 1.1 percent increase in motor vehicle insurance.) Motor fuel prices will stay stable and most likely will be lower by the end of this year.
An increase in worldwide usage in the summer helped the WTI and Brent crude oil benchmarks’ futures both reach new highs at the beginning of August. But with the economic slowdown in the BRIC countries (Brazil, Russia, India, and China) and steady oil production in the U.S., the high price levels are not likely to last. At press time, the average price of regular gasoline at the pump is $3.56 per gallon, lower than the average price in July of $3.59 per gallon.
Among everyday expenditures in July, tobacco and prescription drugs saw the sharpest rise. On average, these items make up a very small portion of Americans’ monthly budget. Tobacco and smoking products increased 1.4 percent, but these only contribute 2 percent of the average American’s everyday expenses. Year-over-year, the price of a smoke was up 2.7 percent in July.
Prescription drugs increased 0.4 percent in July. But they have been trending downward. July prescription drug prices are down 0.1 percent from the year before. The impact of these changes on consumer’s day-to-day outlays has been negligible. Prescription drugs contribute only 3.3 percent of the average American’s everyday expenses.
Overall, prices of Americans’ two biggest outlays, food and gas, are under control, contributing to consumer confidence.
About the EPI
AIER’s Everyday Price Index (EPI) measures the changing prices of frequently purchased items like food and utilities. We do this by selecting the prices of goods and services from the thousands collected monthly by the Bureau of Labor Statistics in computing its Consumer Price Index. The EPI basket contains only prices of goods and services that Americans typically buy at least once a month, excluding contractually fixed purchases such as mortgages. Our staff economists weight each EPI category in proportion to its share of Americans’ average monthly expenditures. In order to better reflect the out-of-pocket prices that consumers experience on a daily basis, the EPI does not seasonally adjust prices.


