Everyday Prices Increase In May
Summer driving season has begun and motor fuel registered a 0.6 percent increase. Motor fuel prices increased across all grades, regular (+0.6 percent), midgrade (+0.8 percent), and premium (+0.4 percent). However if you use mass transit, the price of transportation was flat last month. As for utility bills, electricity took a big jump in May (+4.1 percent) but the price of gas service decreased (-2.3 percent). Beyond the essentials of food and energy, the prices of entertainment goods and services were mixed. If you planned on learning a new sport this summer fees for lessons or instructions increased (+0.3 percent) but the price of attending a sporting event decreased (-0.2 percent).
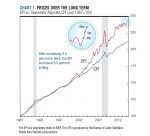
Looking back over the past 12 months the EPI increased 2.5 percent. This is the largest year-over-year increase in the EPI since October 2012. In contrast to the EPI, the CPI increased slightly less year-over-year at 2.1 percent. Food, which includes dining out and trips to the grocery store, increased 2.5 percent over the past 12 months. The increase was led by meats, fish, poultry, and eggs (+7.7 percent), dairy (+4.2 percent), and fresh fruits and vegetables (+3.2 percent). Year-over-year, trips to the gas pump (+2.4 percent) have squeezed daily budgets while prescription drugs (+3.6 percent) and child care (+2.0 percent) have crowded out other expenditures. Check back for AIER’s upcoming Inflation Report which will provide price indexes for people at all stages of life from college to retirement.
About the EPI
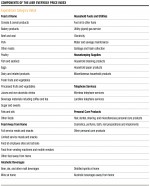
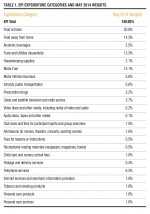
AIER’s Everyday Price Index (EPI) measures the changing prices of frequently purchased items like food and utilities. We do this by selecting the prices of goods and services from the thousands collected monthly by the Bureau of Labor Statistics in computing its Consumer Price Index. The EPI basket contains only prices of goods and services that Americans typically buy at least once a month, excluding contractually fixed purchases such as mortgages. Our staff economists weight each EPI category in proportion to its share of Americans’ average monthly expenditures. In order to better reflect the out-of-pocket prices that consumers experience on a daily basis, the EPI does not seasonally adjust prices.
To learn more about our methodology, view the weights assigned to each component, and browse past EPI updates, visit AIER’s EPI Methodology page.


