Food and Fuel Lead Everyday Prices Higher
AIER’s Everyday Price Index rose 0.8 percent in April from March, led by a 0.2 percent increase in prices for food and a 9 percent jump for gas. The EPI measures the change in prices that people see in their everyday purchases, such as groceries, restaurant meals, gasoline, and internet service.
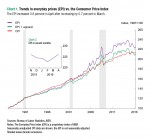
The EPI has dropped 0.8 percent over the past 12 months because of a long decline from July 2015 to February 2016.
The EPI including apparel, a broader measure, posted a 0.8 percent increase in April and a 0.8 percent drop in the past 12 months. Both measures exclude prices of infrequently purchased, big-ticket items (such as cars, appliances, and furniture) and prices that are contractually fixed for prolonged periods (like housing).
The more widely known price gauge, the Consumer Price Index reported by the Bureau of Labor Statistics, increased 0.4 percent in April on a seasonally adjusted basis. The seasonally unadjusted CPI increased 0.5 percent for the month and 1.1 percent over the past 12 months. The EPI is not seasonally adjusted, so we compare it with the unadjusted CPI.
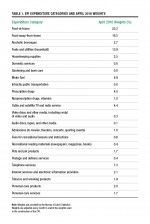
The increase in the EPI was driven by growth in its two major components – food and gasoline. Together they account for nearly half of all everyday products included in the EPI. Food (both food-at-home and food-away-from-home) accounts for about 40 percent and gas another 9 percent. In April, prices for food rose 0.2 percent and gas jumped 9 percent. These changes were primarily responsible for the month’s increase.
There were broad-based gains in other everyday prices, too. Both prescription and non-prescription drug prices rose 0.4 percent. Entertainment prices were higher, admissions to sporting events and shows increased 0.4 percent, and cable prices were up 0.3 percent.
Recent EPI reports have noted that when energy prices stabilize overall, everyday prices will move higher. With the second month in a row of rising gas prices, it seems that the run of cheaper fuel has ended. Households can no longer count on significant savings at the pump.
With the fall in fuel prices ending (and the accompanying cheap gas winfall that allowed additional household spending), the relationship between the EPI and CPI is reverting to its historical norm – the EPI is rising faster than the CPI. Over the past 15 years the EPI tended to grow 2.6 percent per year, while the CPI grew 2.1 percent. When fuel prices were falling last year, the EPI fell, but the CPI continued to rise. Because the EPI covers only about 35 percent of all goods and services included in the CPI, gas prices tend to have a much stronger influence on the EPI than the CPI. But with fuel prices resuming their upward trend, we can expect that everyday prices will now rise faster than the overall CPI.


