Everyday Prices Were Unchanged in February
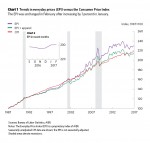
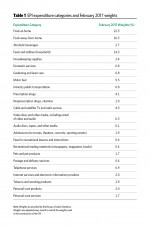
AIER’s monthly Everyday Price Index was unchanged in February because an increase in prices at grocery stores and restaurants was offset by a decline in gasoline prices. The EPI measures price changes that people see in everyday purchases such as groceries, restaurant meals, gasoline, and utilities. Over the past 12 months the EPI has increased 3.3 percent.
The EPI including apparel, a broader measure, rose 0.2 percent. Over the past 12 months, the broader index has increased 3.1 percent. Both measures exclude prices of infrequently purchased, big-ticket items (such as cars, appliances, and furniture) and prices that are contractually fixed for prolonged periods (like housing).
The more widely known price gauge, the Consumer Price Index reported by the U.S. Bureau of Labor Statistics, rose 0.3 percent on a seasonally unadjusted basis in February and increased 2.7 percent over the past 12 months. The EPI is not seasonally adjusted, so we compare it with the unadjusted CPI.
Food prices increased in February. Prices at restaurants increased 0.2 percent in February and have increased 2.4 percent over the last 12 months. Restaurant prices have been supported in part by steady consumer demand. Real consumer spending at restaurants has increased 2.1 percent compared with this time last year. Real consumer spending at restaurants has been helped by a strong labor market. Over recent decades, real consumer spending at restaurants has averaged an annual increase of 1.9 percent.
The Restaurant Performance Index shows that restaurant owners are cautiously optimistic about the future. In February, the Restaurant Performance Index showed that restaurant owners foresee positive trends in same store sales, staffing, capital expenditures, and overall business conditions.
Prices at the grocery store also rose in February. Prices at grocery stores increased 0.2 percent in February. A 5 percent drop in the price of eggs offset price increases in other categories. Non-alcoholic beverages, such as soda and juice, increased 1.4 percent. Meat, poultry, and fish increased 0.5 percent in February, while dairy products increased 0.3 percent. Over the past year, prices at the grocery store have fallen 1.7 percent. In contrast, grocery store prices have grown 2 percent on average over the last 15 years.
Falling agriculture and livestock prices have restrained prices at the grocery store. The GSCI agriculture and livestock index has declined 1.8 percent over the last year. Lower agriculture and livestock prices have translated into a similar decline in wholesale prices faced by grocery stores.
On the energy side, gasoline prices fell 2.1 percent across all grades in February. Regular gasoline decreased 2.3 percent, mid-grade declined 1.6 percent, and premium prices were lower by 0.8 percent. Over the past year gasoline prices have risen 30.6 percent. Crude oil prices have rebounded from around $30 per barrel a year ago to over $50 today. Rising crude oil prices have helped lift production in the U.S. from 8.6 million barrels per day in September 2016 to 9 million barrels per day in February 2017.
In the short-run many forces can affect price changes including changes in relative supply and demand. Over the long run, growth in the money supply tends to lead to rising prices and diminished purchasing power.


