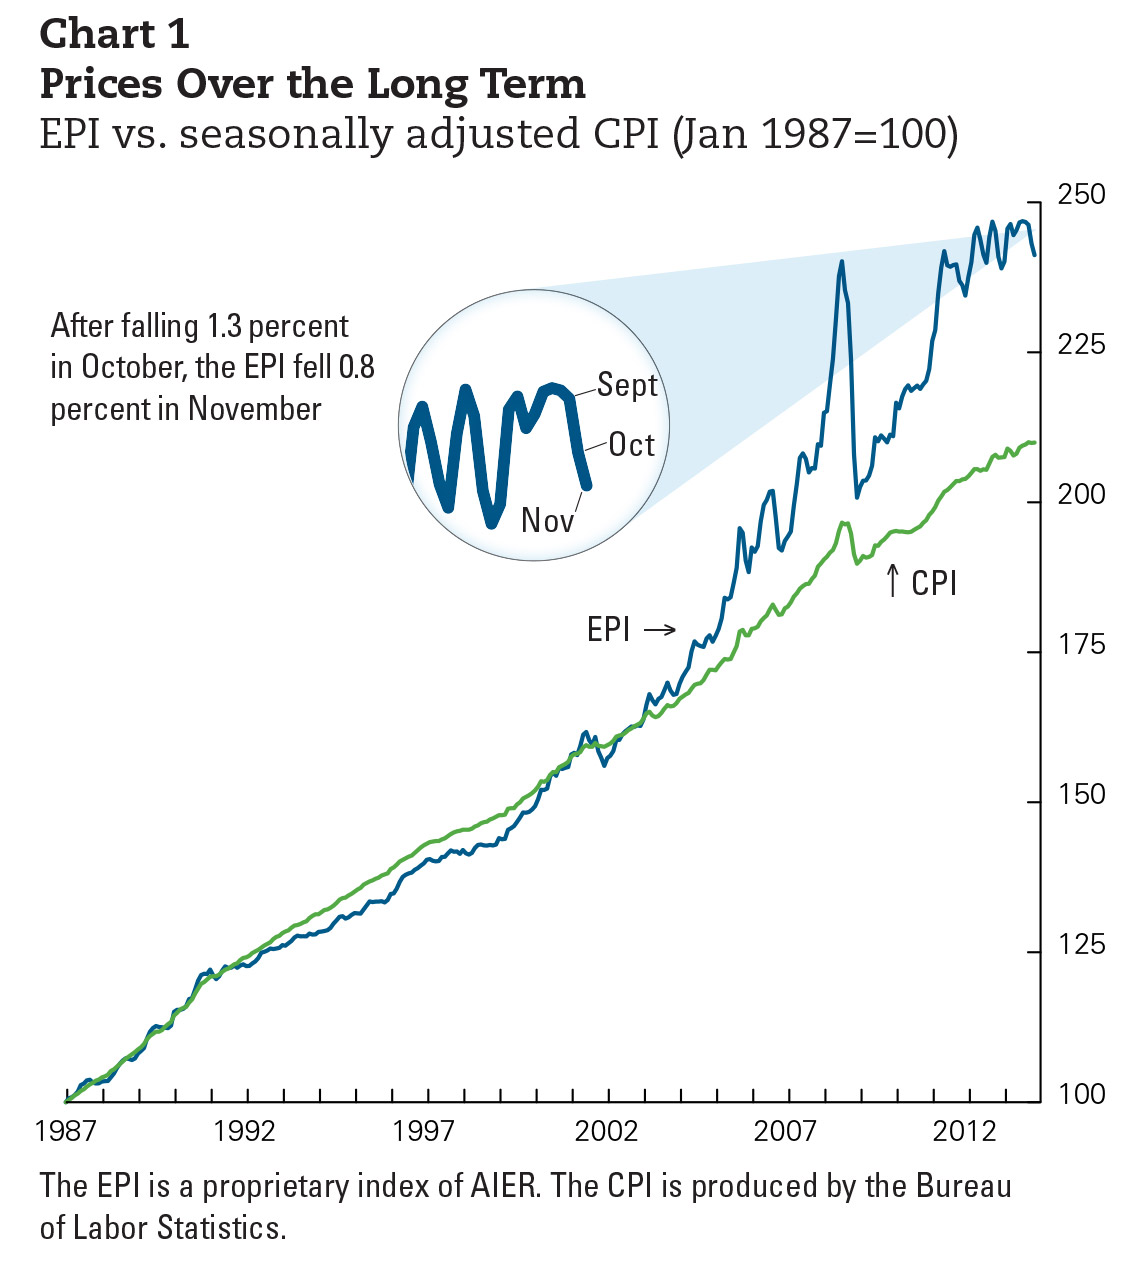
EPI Falls, Earnings Rise
Motor fuel, which makes up almost 14 percent of everyday spending according to the EPI, has now decreased almost 10 percent nationally since June. Energy categories typically are the most volatile components of the Index. The only non-energy categories that saw monthly changes of at least 0.5 percent were entertainment categories such as video discs (-1.9 percent), audio discs (-0.7 percent) and theatre/concert admissions (+1.0 percent), all of which had very small contributions to the overall EPI as a result of small relative weights.
The Consumer Price Index is a broad index that includes all the goods and services that consumers buy over their lives. In contrast, AIER’s Everyday Price Index (EPI) measures the prices of the things they buy on a regular basis. It is tied to day-to-day challenges to consumer budgets. Because it tracks the prices the public most often sees, it is also more closely related to the perceptions people hold about prices and inflation, and the information they use to form expectations and make decisions.
The Core CPI, a measure frequently used by policymakers, excludes food and certain measures of energy that remain critically important to the EPI and to households. In November, food prices rose only 0.1 percent, but were outpaced in specific categories such as bread (+2.6 percent), eggs (+1.1 percent), and the American favorite, frankfurters (+1.6 percent). A more relevant purchase during November, turkeys rose in price 2.5 percent from last November. Even though food accounts for almost 38 percent of everyday purchases, its 0.1 percent overall price increase did little to offset declines in energy prices.
Concurrent with everyday price decreases, November saw increased earnings. Real average earnings for the month rose by 0.2 percent on an hourly basis and 0.4 percent on a weekly basis, partially driven by an increase in the average workweek. Combined with the decreases in the EPI driven by lower fuel costs, the increase in earnings means that everyday people should have a little more to spend this season. While we continue to maintain a keen eye on the pace of inflation, we’ll toast a cup of eggnog to positive news this month.
About the EPI
AIER’s Everyday Price Index (EPI) measures the changing prices of frequently purchased items like food and utilities. We do this by selecting the prices of goods and services from the thousands collected monthly by the Bureau of Labor Statistics in computing its Consumer Price Index. The EPI basket contains only prices of goods and services that Americans typically buy at least once a month, excluding contractually fixed purchases such as mortgages. Our staff economists weight each EPI category in proportion to its share of Americans’ average monthly expenditures. In order to better reflect the out-of-pocket prices that consumers experience on a daily basis, the EPI does not seasonally adjust prices.


