Energy Déjà Vu
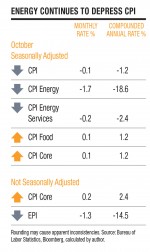
The decline in energy prices was the primary cause of a 0.1 percent decrease in the seasonally adjusted Consumer Price Index (CPI) for October. Gasoline, fuel oil, and natural gas—products with pervasive impact—all fell in price, easily offsetting price increases in food and other goods.
This effect was magnified in day-to-day expenditures as measured by AIER’s most recent Everyday Price Index. The EPI fell 1.3 percent for October, as gasoline, one of the most frequent purchases of many households, fell 2.9 percent for the month, according to the Bureau of Labor Statistics (BLS) data.
While the declines are not likely to continue, they do put more money in people’s pockets. This will translate into higher levels of spending in the critical year-end holiday retail period.
RETAIL PRICES
Falling energy prices outpaced moderate inflation in food prices in the most recent month. While the broad CPI fell by 0.1 percent, the CPI less the volatile food and energy components rose 0.1 percent. Declines in gasoline, fuel oil, and natural gas prices resulted in energy commodity prices falling by 2.7 percent. Electricity prices rose slightly, which helped offset declines in other prices and limited the decline in energy services to 0.2 percent.
As a whole, food prices rose a mere 0.1 percent in October. Meat, poultry, fish, and eggs prices played an important part in this, jumping 0.6 percent, the fifth monthly increase in a row. The prices of fruits and vegetables and nonalcoholic beverages rose, while dairy and cereal prices fell.
Advances were hardly uniform across grocery store food groups, suggesting that prices are probably changing because of relative supply and demand changes rather than broad inflationary pressures.
Once you move outside the food and energy groups, there were a lot of plus signs in the BLS tables of price changes. Some of these price increases were across broad categories and were substantial—suggesting building price pressures.
The prices of used cars and trucks rose 0.3 percent, as did medical care commodities. Physicians’ services rose 0.2 percent and prescription drugs 0.4 percent. Prices for both alcoholic beverages and tobacco went up by 0.1 percent. Rent and owners’ equivalent rent both went up 0.2 percent.
Prices for transportation services rose a whopping 0.7 percent. In particular, airline fares rose 3.6 percent.
The negatives, on the other hand, fell in narrow categories. For example, apparel prices fell 0.5 percent, and new vehicles prices fell 0.1 percent.
WHOLESALE PRICES
The same price patterns evident for retail prices hold for finished goods at the wholesale level, according to the Producer Price Index.
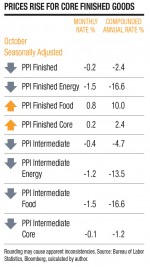
Energy prices fell 1.5 percent in the most recent month, while food prices rose 0.8 percent. Declines in energy prices outpaced increases in food prices. This resulted in an overall price decline for wholesale finished goods of 0.2 percent, but outside the food and energy sectors, prices rose by 0.2 percent.
Finished energy goods prices have not fallen since April, and most of the decline is tied to gasoline, which fell by 3.8 percent. Everything else in this category is a mixed bag, but likely prices of other goods and services are held down by cheaper transportation costs.
Despite this moderating force, wholesale food prices made their biggest jump since March, with about two-thirds of the increase coming from increases for beef and veal.
Rising prices for goods other than food and energy suggest that higher consumer-level prices are on the way.
On a non-seasonally adjusted basis, the prices of passenger cars rose 3.8 percent, and the prices of light trucks increased 4.2 percent. Because the BLS brings the new model years into its indexes in October, it artificially adjusts the prices downward to reflect estimates of increased quality. This suppresses actual price increases, making inflation appear less than actually experienced by wholesalers, retailers, and consumers.
Two-thirds of the 0.4 percent decline in intermediate prices for the most recent month is also due to energy prices. This is the largest decline since April, but is mostly due to declines in diesel fuel and gasoline. This lowers transportation costs—a major factor in intermediate goods. The 1.5 percent decline in intermediate foods and feeds prices is also helped by good crop results, leading to a 6.7 percent decrease in the prices of prepared animal feeds.
DEMAND
While energy prices are, to some extent, out of our control, core prices are more closely related to growing domestic demand and the recovering U.S. economy. Consumer demand is fueled by rising incomes, supported by a reasonably positive outlook.
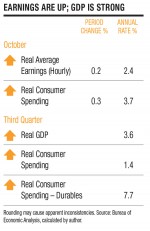
Incomes are rising. In October, real average earnings rose by 0.2 percent on an hourly basis and 0.1 percent on a weekly basis. Nonfarm payroll employment increased in 34 states, and 38 states enjoyed lower unemployment rates from a year earlier. Combined with lower fuel costs, the increase in employment and earnings means that consumers have more to spend, and we would expect them to have an improved outlook.
Unfortunately, it appears that other considerations are weighing down consumer expectations. The latest Conference Board Consumer Confidence Index released November 26, based on data through November 15, reported a reading of 70.4.
While this is still in positive territory, it is the lowest level since April. Consumers surveyed said that the job market was better, but that the economy appears to have slowed. They said they were concerned about the economy six months out, but also feared that holiday retail sales would be weak. It is too early to say if they were right. Early indications are that overall sales for the Thanksgiving weekend were weak.
Online sales seem to have risen. Amazon.com offered discounts every 10 minutes during the holiday week. Traditional retailer Target is reported to have said it doubled online sales over a year ago for some periods during the holiday weekend.
According to Adobe Systems, its online sales for Thanksgiving reached a record $1.06 billion and Black Friday reached a record $1.93 billion. Thursday sales were up 18 percent from a year ago, and Friday sales were up 39 percent.
These results come on the heels of the release of the estimate of third-quarter real gross domestic product by the Bureau of Economic Analysis. According to the Bureau, the output of goods and services in the U.S. increased at an annual rate of 3.6 percent, a jump from 2.5 percent in the second quarter.
This is another sign of the improving health of the U.S. economy. Producers are producing more and are paying out more in wages to workers, in purchases to suppliers, and in profits to investors. The increase was driven by consumer spending, business investment, exports, housing, and state and local spending. This broad-based increase in demand should have an equally broad impact on prices.
SUPPLY
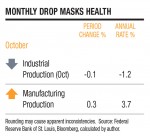
Consumers may be reacting to a perceived drop in industrial production. The Federal Reserve’s Index of Industrial Production fell 0.1 percent in October, after rising 0.7 percent in September.
This slowdown is misleading. Despite the decline, the October index had recovered to its pre-recession 2007 average and was up 3.2 percent compared to a year ago. (Manufacturing production supports the picture of a healthy expansion. It rose 0.3 percent in October, its third monthly gain in a row.)
The October decline in industrial production also includes a 0.1 percent slowdown in consumer goods production, which is also misleading.
The consumer durable goods numbers were dragged down by a decrease in the index for the output of automotive products, which was still 11 percent above a year ago. There were increases in the production of home electronics, appliances, furniture, and other goods. The output of consumer nondurable goods was unchanged.
The production of business equipment increased 0.2 percent in October; the production of information processing equipment rose 0.2 percent; and the production of industrial and other equipment increased 0.3 percent.
Construction supplies increased for the fifth consecutive month, up 0.3 percent in October and up 6.6 percent above its level of a year earlier.
As output continues to expand, so will household incomes and consumer spending and profits and business spending. As lending and borrowing expand, prices, fueled by the ever-expanding money supply, will also rise.
[pdf-embedder url=”https://www.aier.org/wp-content/uploads/2014/01/IR20131212.pdf“]


