ECONOMY
As the dollar strengthens, U.S. goods sold to other countries become more expensive and therefore less competitive in a global marketplace compared with items produced in countries whose currencies are not appreciating. This increase in the cost of U.S. exports tends to reduce demand for those goods, leading to lower output, reduced gross domestic product (GDP) growth, lower profits and potential job losses.
At the same time, the strengthening dollar will reduce the cost of foreign-produced goods for U.S. buyers. This trend is generally good for consumers, who benefit from lower prices, but it can draw sales away from competing U.S. producers and raise pressure to cut operating or production costs. Furthermore, imports reduce GDP growth, so a stronger dollar may put pressure on the economy’s performance. Indeed, the nation’s trade deficit, or the degree to which the value of imports exceeds exports, subtracted about 0.2 percentage points from overall GDP growth last year.
Over the past few years, as the dollar gained, U.S. import growth outpaced that of exports. Chart 2 shows the relationship between the dollar and U.S. trade flows. In the chart trade flows are represented by the difference between the growth of imports and growth of exports. Since a rising dollar makes imports cheaper while boosting the price of U.S. exports, it makes sense that the growth rate differential would climb in tandem with the U.S. currency. While there are three brief periods where the relationship between the two indicators breaks down, the chart shows that, broadly speaking, the relationship between the two generally holds true. Therefore, if the dollar continues to rise, U.S. GDP growth is likely to slow.
A rising dollar is probable in the short term, given the stronger U.S. economy relative to the rest of the world and the likelihood that U.S. interest rates will head higher while many of the world’s central banks ease monetary policy. The good news, however, is that trade makes up a relatively small portion of U.S. economic activity (exports are about 13 percent of GDP and imports about 16 percent) compared with many other developed economies in the world.
Economic Outlook
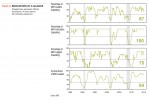
AIER’s Business Cycle Conditions (BCC) leading indicators weakened to 67 in the latest month, the second decline in a row, but still suggest economic expansion in the quarters ahead. We combine our 12 leading indicators into a single index where a reading above 50 percent indicates continued economic expansion is likely.
Click for interactive Indicators at a Glance (on mobile device turn to landscape)
In addition, we also calculate three other AIER measures: a cyclical score for our 12 leading indicators, an index of coincident indicators, and an index of lagging indicators. Our cyclical score of leading indicators registered a reading of 84 in January, marking its 66th month above 50 and confirming the expansionary reading from our leading index.
The index of coincident indicators posted a reading of 100 in December, the 37th month in a row with a perfect 100 reading and the 60th month above 50. Among our six coincident indicators, three hit new cycle highs in the latest month.
For the index of lagging indicators, January came in at 75, breaking a string of perfect 100 readings for 8 straight months and 29 times in the last 32 months. Among the lagging indicators, three of the six were at new cycle highs while two had indeterminate trends and one was trending lower. Overall, all of our indexes indicate a slightly weaker economy but remain above the neutral level of 50 and still suggest continued growth in the quarters ahead (Chart 3).


