Drop in Energy Prices Offsets a Jump in Apparel Prices in March

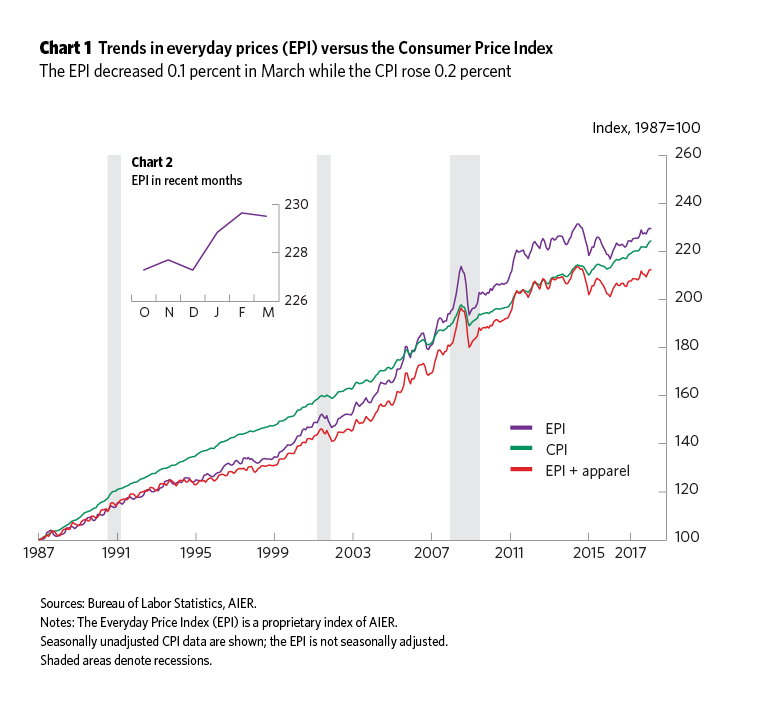
AIER’s Everyday Price Index fell 0.1 percent in March following a 0.4 percent rise in February. The EPI measures price changes people see in everyday purchases such as groceries, restaurant meals, gasoline, and utilities. As a comparison, the more widely known price gauge, the Consumer Price Index, which is reported by the Bureau of Labor Statistics and includes less frequently purchased items, rose 0.2 percent in March. The EPI is not seasonally adjusted, so we compare it with the unadjusted CPI.
The EPI including apparel, a broader measure, rose 0.1 percent in March as apparel prices rose for a third consecutive month, on a not-seasonally-adjusted basis. The EPI and the EPI including apparel exclude prices of infrequently purchased, big-ticket items (such as cars, appliances, and furniture) and prices contractually fixed for prolonged periods (such as housing).
Over the past 12 months, the EPI has risen 2.4 percent while the EPI including apparel is up 2.3 percent. For the same period, the CPI is up 2.4 percent. Over the last five years, the EPI and the EPI including apparel are up at an annualized rate of just 0.3 percent while the CPI is up 1.4 percent.
In the latest month, the 1.6 percent jump in apparel prices was offset by a 0.3 percent drop in motor-fuel prices and a 0.5 percent decline in other fuels and utilities prices. Apparel prices have risen for three consecutive months on a not-seasonally-adjusted basis. However, over the past 12 months, they are up just 0.3 percent. Over the last 5 and 20 years, apparel prices are unchanged and down 0.2 percent at annual rates, respectively.
Motor-fuel prices fell an unadjusted 0.3 percent in March but are up 11.2 percent from a year ago. Over the last two decades, motor fuel is up at a 4.7 percent annual rate, though the five-year annualized change is −5.9 percent.
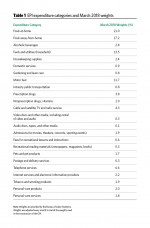
Among the components of the EPI, 13 of the 24 categories were up in March while 11 were down. For the components with the largest weights in the EPI, food at home (21.0 percent weight) was unchanged in March and up 0.4 percent from a year ago, food away from home (17.2 percent) rose 0.1 percent in March and is up 2.5 percent over the last 12 months, household fuels and utilities (13.5 percent) were down 0.5 percent last month but up 3.0 percent for the year, and motor fuel (11.7 percent) was down 0.3 percent last month and has gained 11.2 percent since last March. Combined, these top four categories account for 63.4 percent of the EPI.
The key take-aways are that while some prices have firmed, broad-based increases are still not present in everyday prices and some areas have experienced outright price declines over the past year and the past five years. Apparel and energy have been the dominant drivers of month-to-month changes in everyday prices in recent months.


