December Business Conditions Monthly


AIER’s Business Cycle Conditions Leading Indicators index jumped to 92 in November from a reading of 79 in the prior month. The Roughly Coincident Indicators index rebounded to a perfect 100 after seven consecutive months at 100 were followed by a 92 in October. The Lagging Indicators index remained at 50 for the second month in a row (see chart below). A rebound in AIER’s leading indicators was expected as the impacts from Hurricanes Harvey and Irma have faded.
New economic data received over the past month point to a broadening base for continued economic expansion in the months and quarters ahead. Stronger growth, however, increases the risk of accelerating wage and price increases and therefore more aggressive monetary policy normalization. In addition, fiscal policy changes on the verge of being enacted at the time of this writing could have a significant impact on patterns of economic activity, distribution of wealth and disposable income, and the fiscal position of the federal government. These risks justify concern and heightened attention to economic and financial-market data.
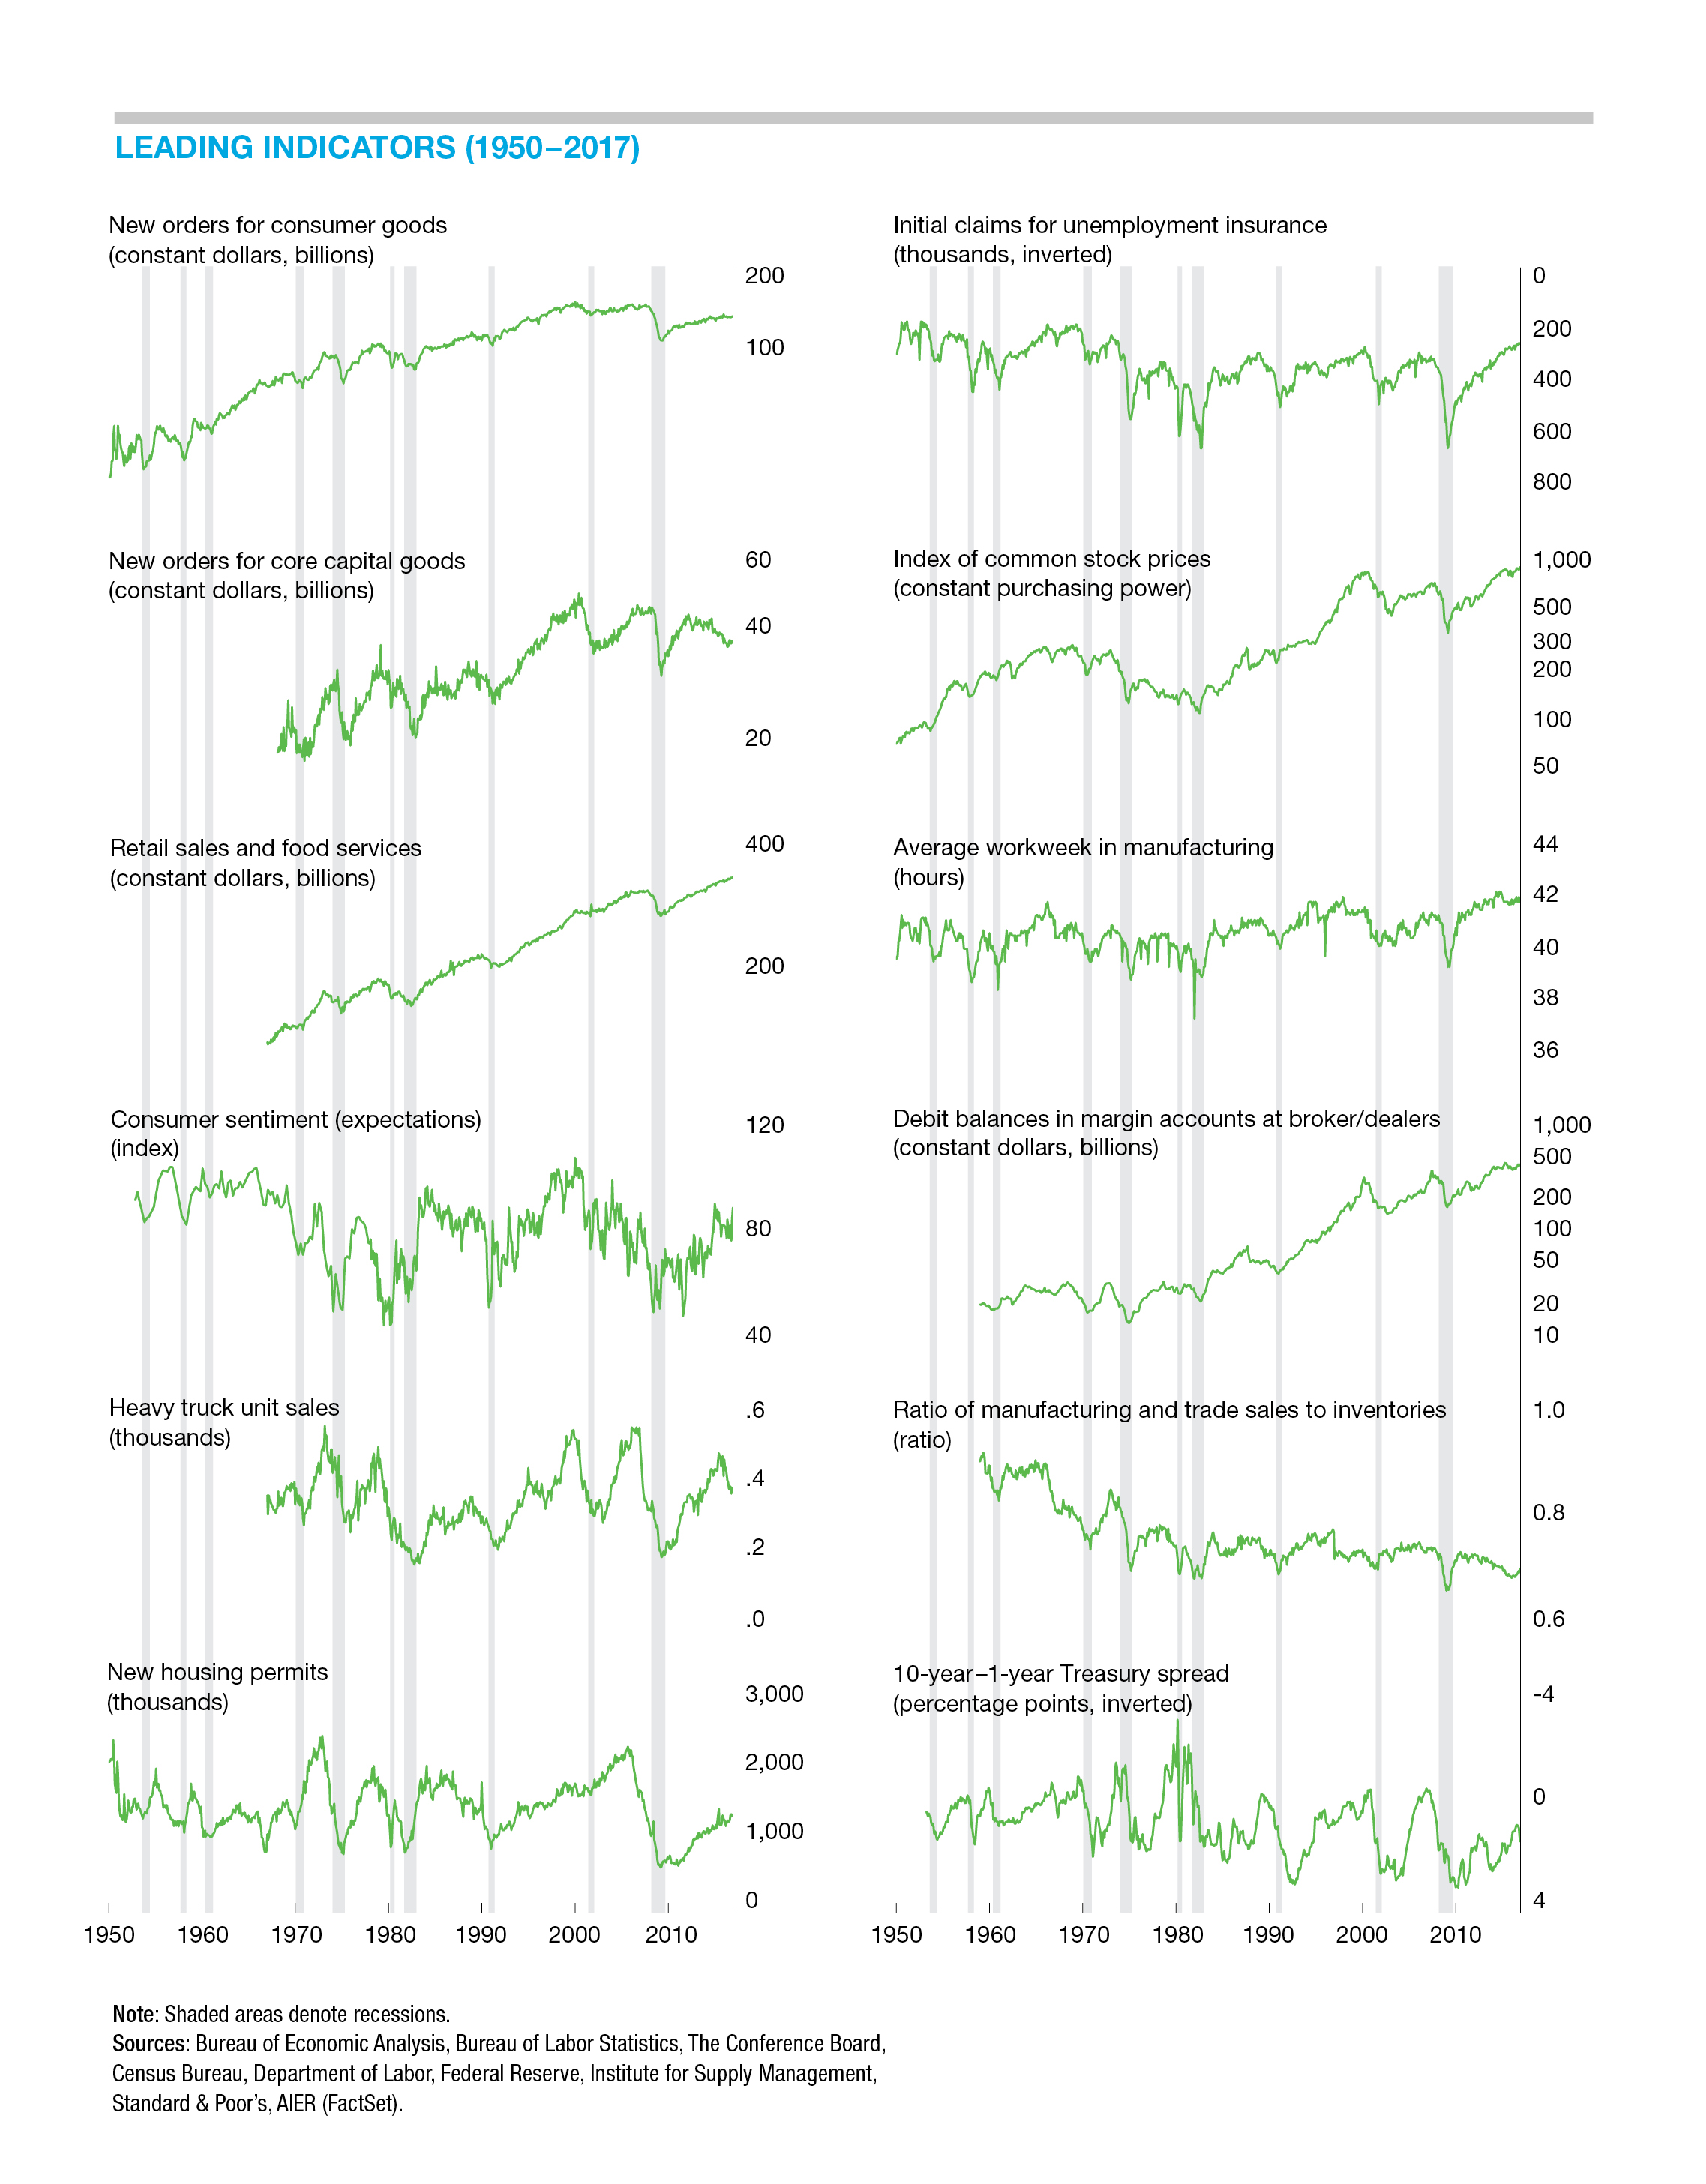
Leading Indicators Point to Continued Expansion
Ten indicators were expanding in November while two were neutral and none were declining. That compares to eight expanding, one declining, and three neutral in October.
Three indicators changed direction in November. Initial claims for unemployment, one of the first data series to reflect the impact of Hurricanes Harvey and Irma, improved to neutral in November after being negative for the previous two months. The extremely low level of initial claims is widely viewed as a sign of strength for the labor market. However, there is a natural lower bound, suggesting that this indicator may stay in a flat trend and therefore remain neutral in our model.
Housing permits and the average workweek in manufacturing both improved from neutral trends to expanding trends in the latest update. As with initial claims, hours worked have a natural boundary, which may limit positive contributions to the leaders index in the future.
Housing permits returned to an expanding trend in November. Housing has recovered from the lows of the housing bust during the previous recession, but overall activity remains well below prior peaks, suggesting room for growth. Consumer fundamentals remain positive, and builders have been careful not to overbuild and create a glut. The outlook is generally favorable, though higher interest rates could restrain gains in the future.
The Leading Indicators index is at its highest level since 2014 and has posted a run of 12 consecutive months at or above 75 (where 50 is neutral), the best run since a 12-month run from February 2013 through January 2014. A lengthy string of readings above 75 suggests the risk of recession in coming months remains low.
The Coincident Indicators index rebounded to 100 following a reading of 92 in October. That wobble broke a string of seven consecutive perfect readings (of 100), the first such run since October 2014 to April 2015. All six of the coincident indicators now show strong expansion trends. The improvement resulted from better gains in industrial production. Industrial production had slowed to a neutral trend in October following about a year of favorable results. The Federal Reserve, which compiles the industrial-production data, has stated that some recent results had been impacted by disruptions from past hurricanes.
AIER’s Lagging Indicators index held at a neutral 50 reading in the latest month. Overall, three indicators are trending higher and three are trending lower.
Economic Activity Continues to Expand
Revised estimates show real GDP grew at a 3.3 percent pace in the third quarter compared to a 3.1 percent pace in the second quarter. The initial estimate for the third quarter was 3.0 percent.
Real personal consumption expenditures grew at a revised 2.3 percent pace, slightly below the 2.4 percent gain in the initial estimate and significantly below the 3.3 percent pace of the second quarter. Spending on durable goods and consumer services both decelerated in the quarter while spending on nondurable goods accelerated.
Fixed investment posted a 2.4 percent pace in the latest quarter, revised up from a 1.5 percent gain in the initial estimates. The upward revision still leaves the pace of growth below the 3.2 percent gain in the second quarter. Business (nonresidential) fixed investment posted a 4.7 percent gain, led by a 10.4 percent jump in equipment and a 5.8 percent rise in intellectual products, while nonresidential-structure investment fell 6.8 percent.
Residential investment (housing) posted its second consecutive quarterly decline, dropping 5.1 percent after a 7.3 percent drop in the second quarter. The resumption of an expanding trend in the housing-permits indicator in the leaders index suggests housing may return to positive growth.
The labor market remains robust, with the economy adding 228,000 jobs in November. That gain puts the increase in jobs for the first 11 months of 2017 at 1.9 million, slightly below the 2.1 million, 2.5 million, and 2.3 million gains for the first 11 months of 2016, 2015, and 2014 respectively. The cumulative effect has been to push the unemployment rate down to 4.1 percent as of November. Furthermore, the continuing low level of claims and the near-record 6 million open jobs across the economy—results supported by several surveys that suggest businesses are still looking to hire—both point to continued jobs gains in coming months.
Prices, Money, and Credit Measures Remain Moderate
The overall GDP price index rose at a 2.1 percent pace, compared to just 1.0 percent in the second quarter. Over the last four quarters, the GDP price index is up a more mild 1.8 percent. The largest price increases in the third quarter came from residential and nonresidential structures (both increasing 4.5 percent), services imports (up 5.0 percent), and state and local prices (rising 3.2 percent).
Prices of personal consumption expenditures, the measure preferred by the Fed, rose 1.5 percent in the third quarter. The PCE price index is up 1.5 percent from a year ago while the core PCE prices index, which excludes volatile food and energy items, is up just 1.4 percent over the last year. That stretch of sub-2 percent increases is about as close to price stability as the United States has ever experienced.
Money supply, as measured by the M2 aggregate, is growing at a 3.8 percent annualized rate over the three months through October. That pace of growth has been decelerating since hitting a peak of 10 percent in January 2016. Over the last 20 years—the period during which price increases have been relatively low and stable—M2 has grown at an average rate of 6.4 percent.
Bank lending is up just 3.4 percent over the past year, though the three-month pace has picked up to a 5.0 percent rate in the most recent period. Still, that pace is below the 6.2 percent growth in bank lending over the past two decades.
Capital Markets
The S&P 500 has hit 57 new record highs during the first 11 months of 2017 and has more than tripled since the market low in 2009. Supporting that performance have been solid growth from domestic demand and accelerating growth overseas, which have helped push U.S. corporate profits to a new record high. For the economy in aggregate, after-tax corporate profits excluding inventory-valuation adjustments and capital-consumption adjustments—both used in national income accounting—hit an all-time high of $1.86 trillion at a seasonally adjusted annual rate in the third quarter. That represents a 10.0 percent gain from the third quarter of 2016. The economy-wide measures corroborate public companies’ reports—followed closely by market analysts—of generally strong corporate earnings. Even with strong growth in earnings, price gains have pushed price–earnings multiples to the highest levels since 2000.
While U.S. equity markets have been hitting new highs, bond yields have been relatively steady. The benchmark 10-year Treasury yield is currently around 2.3 percent and has been in the 2.1 to 2.6 percent range for most of the past year. Corporate bond yields have had a similar range-bound performance, and the outlook for corporate yields from the Survey of Professional Forecasters, conducted by the Philadelphia Federal Reserve, shows expectations call for slowly rising yields over the coming year, though the level is still expected to remain in the past five years’ range.
Special Topic: Debt
Debt growth and debt levels remain key indicators of business cycles and key signals for policy makers. For consumers, who account for almost 70 percent of real GDP in the United States, debt levels remain at seemingly manageable levels. According to the latest Flow of Funds release from the Federal Reserve, consumer debt rose 3.7 percent in part because mortgage debt rose 2.7 percent and consumer credit rose 4.9 percent.
Despite the rise in debt, household net worth hit a record $96.9 trillion as of the third quarter of 2017. The market value of equities held directly and indirectly rose $1.1 trillion while real estate increased $0.4 trillion.
Servicing debt remains relatively easy, with the financial-obligations ratio and the more narrow debt-service ratio both near 40-year lows. The household Debt Service Ratio (DSR) is the ratio of total required household debt payments to total disposable income. The Financial Obligations Ratio is a broader measure than the Debt Service Ratio. It includes rent payments on tenant-occupied property, auto lease payments, homeowners’ insurance, and property tax payments. Rising interest rates may drive those ratios higher in coming quarters, but rising disposable incomes should help offset some pressures.
For the federal government, total debt outstanding totaled $20.3 trillion—103.8 percent of nominal GDP—through the end of fiscal year 2017 (September 2017). Some of that debt, $5.56 trillion, is held in intragovernmental accounts. Debt held by the public totaled $14.7 trillion through the end of FY 2017, or 75.3 percent of GDP. Both shares have risen dramatically since the last recession. As of the fourth quarter of 2007, total debt outstanding as a share of nominal GDP was 62.8 percent while debt help by the public was 35.0 percent.
Current projections from Congressional Budget Office show the annual federal deficits are expected to widen over the next decade, reaching 5.2 percent of GDP in 2027 versus 3.5 percent in FY 2017. That would push total debt as a share of GDP to 109.8 percent and debt held by the public as a share of GDP to 91.2 percent. None of these projections account for the pending tax-reform bill working its way through Congress. Early estimates suggest the changes could increase the total debt by an additional $1 trillion over the next 10 years.
[pdf-embedder url=”https://www.aier.org/wp-content/uploads/2017/12/BCM_December2017.pdf“]Robert Hughes

Robert Hughes joined AIER in 2013 following more than 25 years in economic and financial markets research on Wall Street. Bob was formerly the head of Global Equity Strategy for Brown Brothers Harriman, where he developed equity investment strategy combining top-down macro analysis with bottom-up fundamentals. Prior to BBH, Bob was a Senior Equity Strategist for State Street Global Markets, Senior Economic Strategist with Prudential Equity Group and Senior Economist and Financial Markets Analyst for Citicorp Investment Services. Bob has a MA in economics from Fordham University and a BS in business from Lehigh University.


