Confidence Runs High


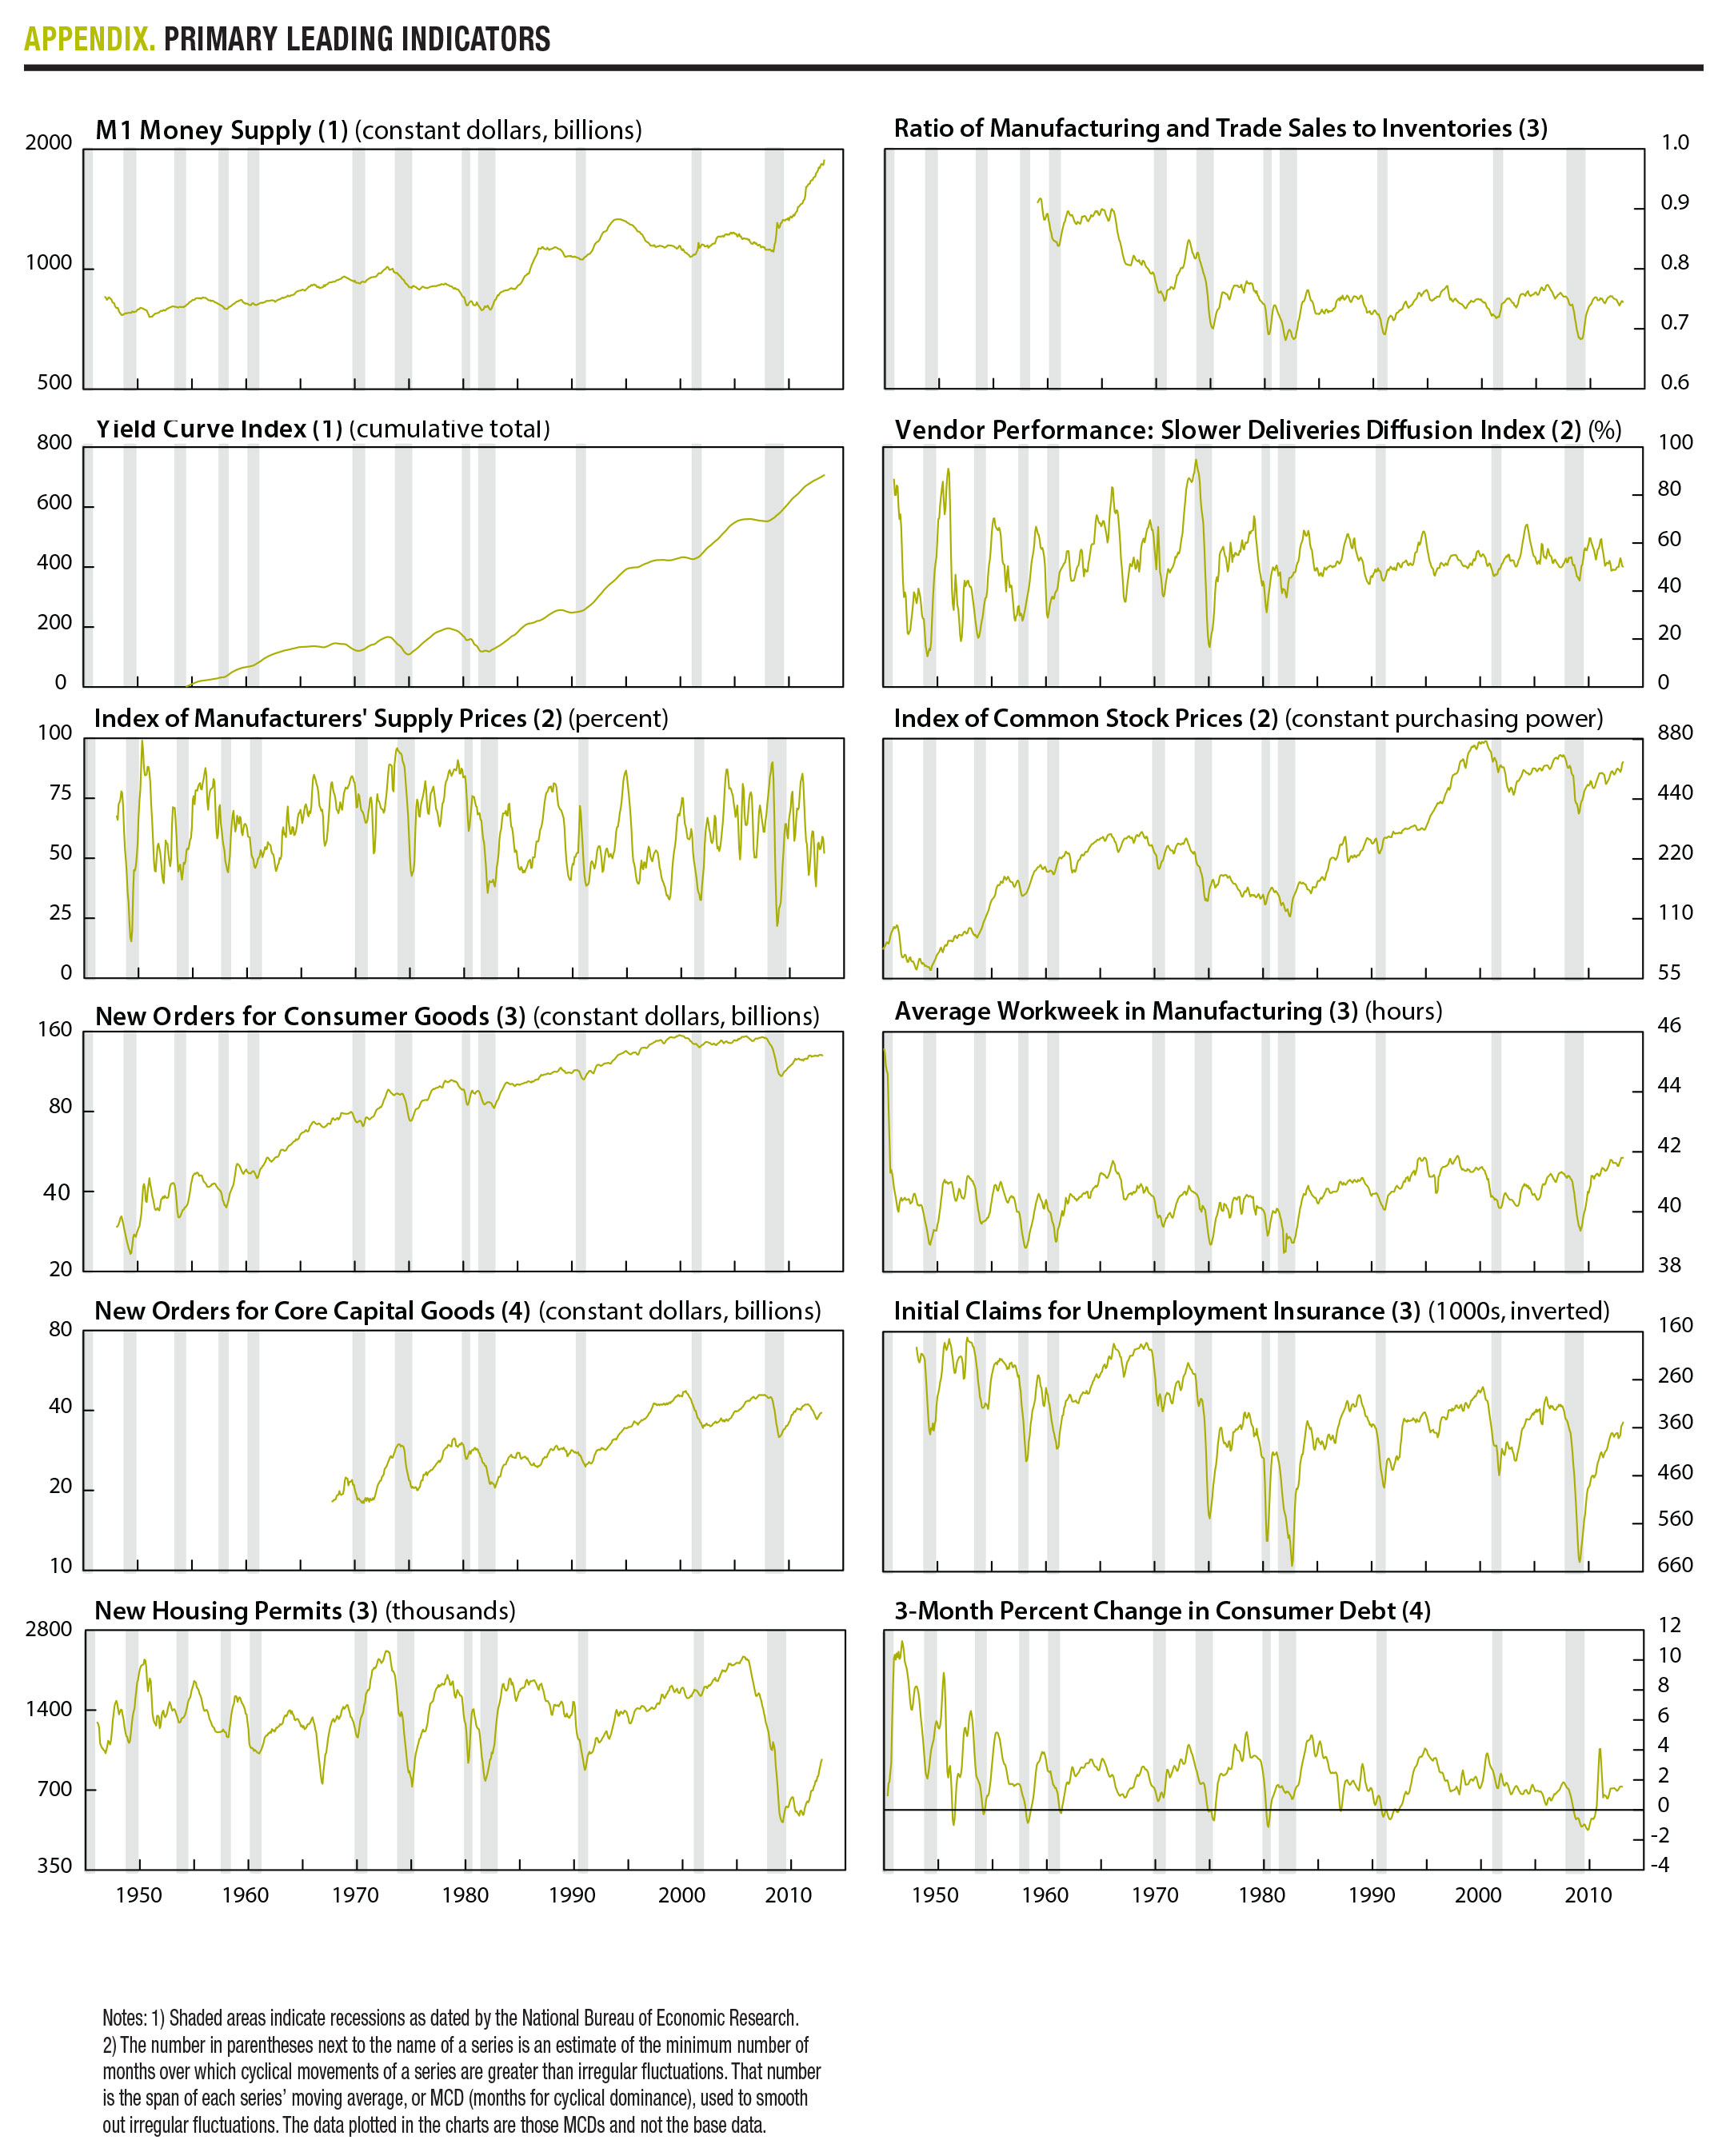


AIER’s analysis of business-cycle conditions also reflects the slowdown. Our experts find that 83 percent of our primary leading indicators are expanding (10 out of 12 for which a trend is apparent), down from 100 percent last month. The cyclical score of leading indicators, derived from a separate, mathematical analysis, also stands at 83.
Our coincident and lagging indicators both posted scores of 100 percent, signaling that the recovery is slated to continue despite the recent slowdown. For all our indicators, a value above 50 suggests that economic expansion is likely to continue.
Signs of consumer optimism abound, led by the steady growth of the housing market. The number of new housing permits, one of our leading indicators, has increased 90 percent since January 2011. Though the one million new permits issued in April make up less than half the monthly permits issued at the 2006 peak, the steady growth in new housing starts augurs well for the recovery.
Planned housing starts don’t tell the whole story. New homes sales went up by 29 percent in the 12-month period ending in May 2013. Sales of existing homes rose 12.9 percent during the same period. Existing home sales are now at the highest level since November 2009, four months after the start of the economic recovery.
Housing prices also have been on a steady upward trend over the past year, and the increases are widespread, according to the Case-Schiller indices. The S&P/Case-Shiller 20 City Composite Home Price Index registered a solid 9.46 percent increase between May 2012 and April 2013. Higher prices mean higher home equity and household wealth, an important driver to consumer expectations.
Right now consumer confidence is robust. The Conference Board Consumer Confidence Index improved 7.1 points in June, up to 81.4. This is its third consecutive monthly increase. The index is now at the highest point since January 2008—the start of the Great Recession, when people were still relatively optimistic about the economy. A five-point change in the index is typically considered significant. The sharp improvement in consumer optimism indicates that fear of living in a recession is a worry of the past, as are concerns about the impact of the fiscal cliff and the budget sequester.
The improved outlook and growing wealth are already being felt in consumer spending. New orders for consumer goods, another leading indicator, continues its steady upward trajectory. New orders in April hit $129.3 million, around $26 million below the pre-recession high of August 2007.
But the real positive is that orders for consumer goods have been growing steadily for the past four years. Consistently rising consumer demand not only helps the economy grow, it also allows producers to plan ahead.
In fact, business owners are showing confidence too. New orders for capital goods, another leading indicator, has been rising for a year. Businesses are building up their capital base for future production. This view is echoed by commercial and industrial loans, a lagging indicator that has been on a steady upward trend since early 2011.
With unemployment at 7.6 percent, the jobs market still has a long way to go. But the addition of 195,000 new jobs in June is consistent with an improved outlook.
AIER’s labor market indicators also suggest that there is reason to be modestly optimistic about employment. The average workweek in manufacturing, a leading indicator, has been consistently rising since January and is now at 41.7 hours per week. The economy is reaching a point where firms are not going to want to expand workers’ hours much more. It will be cheaper to hire more employees and pay less overtime.
Meanwhile, initial claims for unemployment insurance have been steadily declining for a year. The average duration of unemployment has fallen from 40 weeks in January to 37 weeks in just the past month. Fewer people are losing their jobs, and unemployed people are getting back to work faster.
While the recovery looks steady for now, its shape raises a few concerns about long-term growth. Real disposable income has been following a lower trajectory since the 2008 recession and is growing at a slower rate, as the chart above shows. Low income growth leads to diminished consumer spending, which accounts for about two-thirds to three-quarters of GDP. This translates into slower business activity and slower hiring—leading to even slower income growth.
Slow income growth also poses a threat to household savings. Because disposable income is growing more slowly, households are dipping into their savings to fuel current consumption. The household savings rate has dropped to around 3 percent, just a hair above pre-recession levels.
Rather than saving, today’s optimistic consumers are borrowing to finance their spending. The ratio of consumer debt to personal income, a lagging indicator, is on an upward trend. Consumer debt is rising faster than disposable income. As we saw in 2008-09, a low savings rate and high personal debt puts households in precarious positions during a liquidity crisis that stems from loss of income. That can be disastrous for individuals.
The combination of low personal savings and high debt is also bad for businesses. Long-term economic growth depends on investment, and household savings are also a primary domestic source of future investments. Lower household savings means that business must rely more heavily on foreign sources of investment. This makes American businesses more vulnerable to external economic conditions such as foreign interest rates.
One special kind of debt poses another potential threat to the economy’s long-term health. Many speculate that steadily mounting student loan debt will create the next big national crisis. As of March 2013, total outstanding student debt is $986 billion, the highest level in history.
A whopping 40 percent of households headed by an adult younger than 35 had outstanding student debt as of 2010, compared to 26 percent in 2001. For households headed by people 35 years and older, those with student debts increased from 7 percent in 2001 to 13 percent in 2010. This debt load limits younger generations’ present and future purchasing power and will dampen future growth.
The burden also puts low-income earners with high student debt at high risk for defaulting, with a potentially huge ripple effect.
[pdf-embedder url=”https://www.aier.org/wp-content/uploads/2014/01/AIER_BCC_July_2013.pdf“]

