Bitcoin’s Price Volatility is Trending in the Wrong Direction


It only takes a quick glance at recent news to know Bitcoin is volatile; its fluctuations in price have made headlines for months now. But exactly how volatile is it relative to commonly used currencies, and how does that affect this cryptocurrency’s ability to actually be a usable medium of exchange?
This article compares the daily volatility of the Bitcoin/dollar exchange rate with that of the pound, the euro, the yen, and a reliable store of value, gold. We find that both the average daily price change and the standard deviation of Bitcoin are several times higher than our benchmarks.
We also find that Bitcoin changed with respect to its volatility between 2016 and 2017. In 2016, Bitcoin had periodic episodes of high volatility and behaved more like benchmark currencies in other periods. In 2017, however, high volatility was constant through the year.
Why Volatility Matters
The future is unpredictable, which can be a huge deterrent to planning and coordination of plans. A medium of exchange that is stable in value and highly liquid, so someone can trade it in a pinch without taking a hit, allows us to better deal with uncertainty and helps us plan and coordinate into the future. Assets that are too volatile are therefore undesirable as currencies.
When considering Bitcoin’s potential future viability as a currency, it is therefore important to understand its volatility relative to widely used currencies, and whether that relative volatility is changing over time. It must be stressed that past volatility doesn’t rule out future stability, but as we discuss below, Bitcoin’s relative volatility has increased in the past two years.
Trending in the Wrong Direction
The two tables below provide summary statistics for Bitcoin and our four benchmarks separately for 2016 and 2017. In 2016, Bitcoin’s average daily price change (measured as the absolute value of the percentage change in the dollar exchange rate) exceeds the benchmark currencies’ by a factor of three to four, and is over twice the average daily price change of gold. The results are even more stark when looking at standard deviation, where Bitcoin exceeds the benchmarks by factors of three to six.
Table 1. 2016 summary statistics
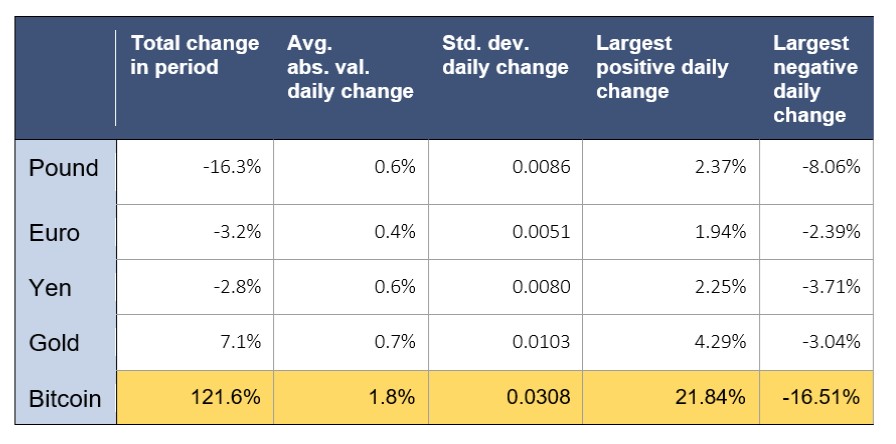
Sources: www.quandi.com (XAU/USD), www.investing.com (GBP/USD, EUR/USD), www.macrotrends.net (USD/JPY) and www.coindesk.com (BTC/USD)
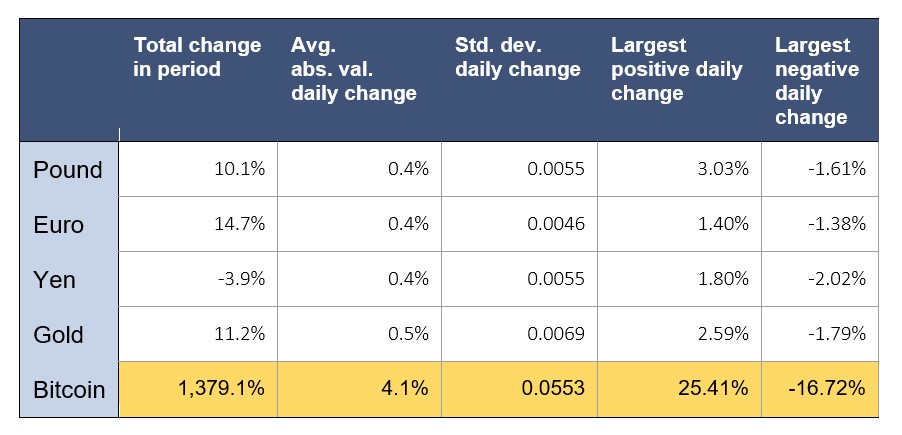
Already high in 2016, the 2017 increase in Bitcoin’s volatility relative to the benchmarks is striking. Though the price of Bitcoin increased by over 14-fold in 2017, the volatility measures are consistently almost 10 times higher than the benchmarks. We also analyzed data on the Mexican peso, the ruble, the rand, and the Turkish lira, currencies that might be expected to be less stable, and found that Bitcoin’s relative volatility was almost as high as for the benchmarks shown here.
Table 2. 2017 Summary statistics
Ups and Downs
While the numbers alone tell a consistent story about Bitcoin’s high relative volatility, a visual representation is particularly striking. The chart below, which graphs the daily percentage change in exchange rates, reveals the enormous single-day changes in Bitcoin’s price. It is notable that in 2016, Bitcoin appears to have gone through some periods where its volatility was much closer to the benchmarks, but by 2017, those periods all but disappeared.
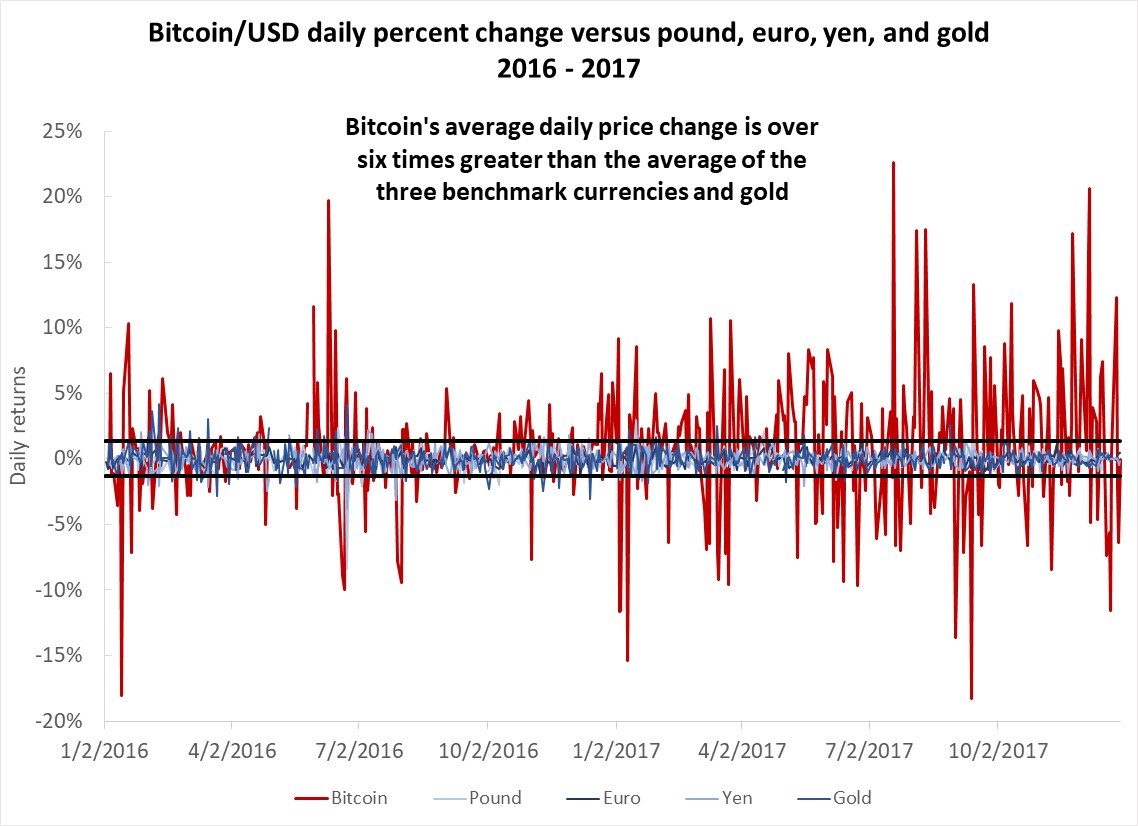
The horizontal bands on the graph show the range in which 95 percent of the daily changes in the benchmark currencies and gold fall. Bitcoin’s daily price changes exceed this 95 percent interval a staggering 280 days, or 54 percent of the time, in 2016 and 2017.
To confirm our findings about Bitcoin’s relative volatility over time, we developed a measure of standard deviation based on a 20-day exponentially weighted moving average of Bitcoin’s price over time. The results follow the same pattern as the daily percentage changes above. Though 2016 is characterized by periods where Bitcoin’s volatility is closer to the benchmarks, it is punctuated by periods of far greater volatility. In 2017, this measure of volatility once again remains uniformly higher than that of the currencies to which it is being compared.
A Regime Change?
This study has sought to quantify the degree to which Bitcoin is more volatile in its dollar price than more commonly used currencies. Basic measures such as average daily percentage change and standard deviation are over six times as large as those for the benchmarks during 2016 to 2017. But Bitcoin seems to have experienced something of a regime change, going from periods of great volatility in 2016 to consistently high volatility in 2017.
History is full of examples of assets that rose or fell meteorically, but despite its overall positive trend, it is difficult to think of a precedent for the level of up-and-down volatility experienced recently by Bitcoin. This raises the intriguing question of why. Is it a price-discovery process for an extremely novel piece of technology, is there something in the trading process that causes large swings, or are there frequent cases of market manipulation? Quantifying Bitcoin’s volatility relative to that of commonly used currencies is an important first step, but this topic is certainly ripe for further research.
This article is based on research begun by four students at Missouri University of Science and Technology during a two-week intensive program held on-site at AIER. We thank Alexandra Emily, Noah Madrigal, Zhiwei Lu, and Noah Williams for their excellent research, and their professor Ana Ichim for steadfast guidance. We also particularly thank Alexandra for continuing to work on and contribute to this project after the program ended.
Max Gulker

Max Gulker is a former Senior Research Fellow at the American Institute for Economic Research. He is currently a Senior Fellow with the Reason Foundation. At AIER his research focused on two main areas: policy and technology. On the policy side, Gulker looked at how issues like poverty and access to education can be addressed with voluntary, decentralized approaches that don’t interfere with free markets. On technology, Gulker was interested in emerging fields like blockchain and cryptocurrencies, competitive issues raised by tech giants such as Facebook and Google, and the sharing economy.
Gulker frequently appears at conferences, on podcasts, and on television. Gulker holds a PhD in economics from Stanford University and a BA in economics from the University of Michigan. Prior to AIER, Max spent time in the private sector, consulting with large technology and financial firms on antitrust and other litigation. Follow @maxg_econ.