August Business Conditions Monthly


The AIER Business Cycle Conditions Leaders index rebounded in July to a reading of 83 from 75 in the prior month. The Coinciders index remained at a perfect 100 for a fifth month while the Laggers index dropped to 50 from 58 in June (chart 1). The rebound in our Leaders marginally reduces concern that the economy may be entering another soft patch.
Faster economic growth in the second quarter combined with mostly favorable data on economic activity in the first month of the third quarter support the case for marginally reduced concern over pockets of weakness. Despite the firming of activity in the second quarter and beginning of the third quarter, price increases remain very modest. Overall, the outlook remains favorable, with continued economic expansion and moderate price increases.
Leaders Rebound As Four Indicators Show Improvement
Eight indicators were expanding in July while four were neutral and none were declining. That compares to eight expanding, two declining, and two neutral in June. July marks the first time in several years that no indicators were trending lower.
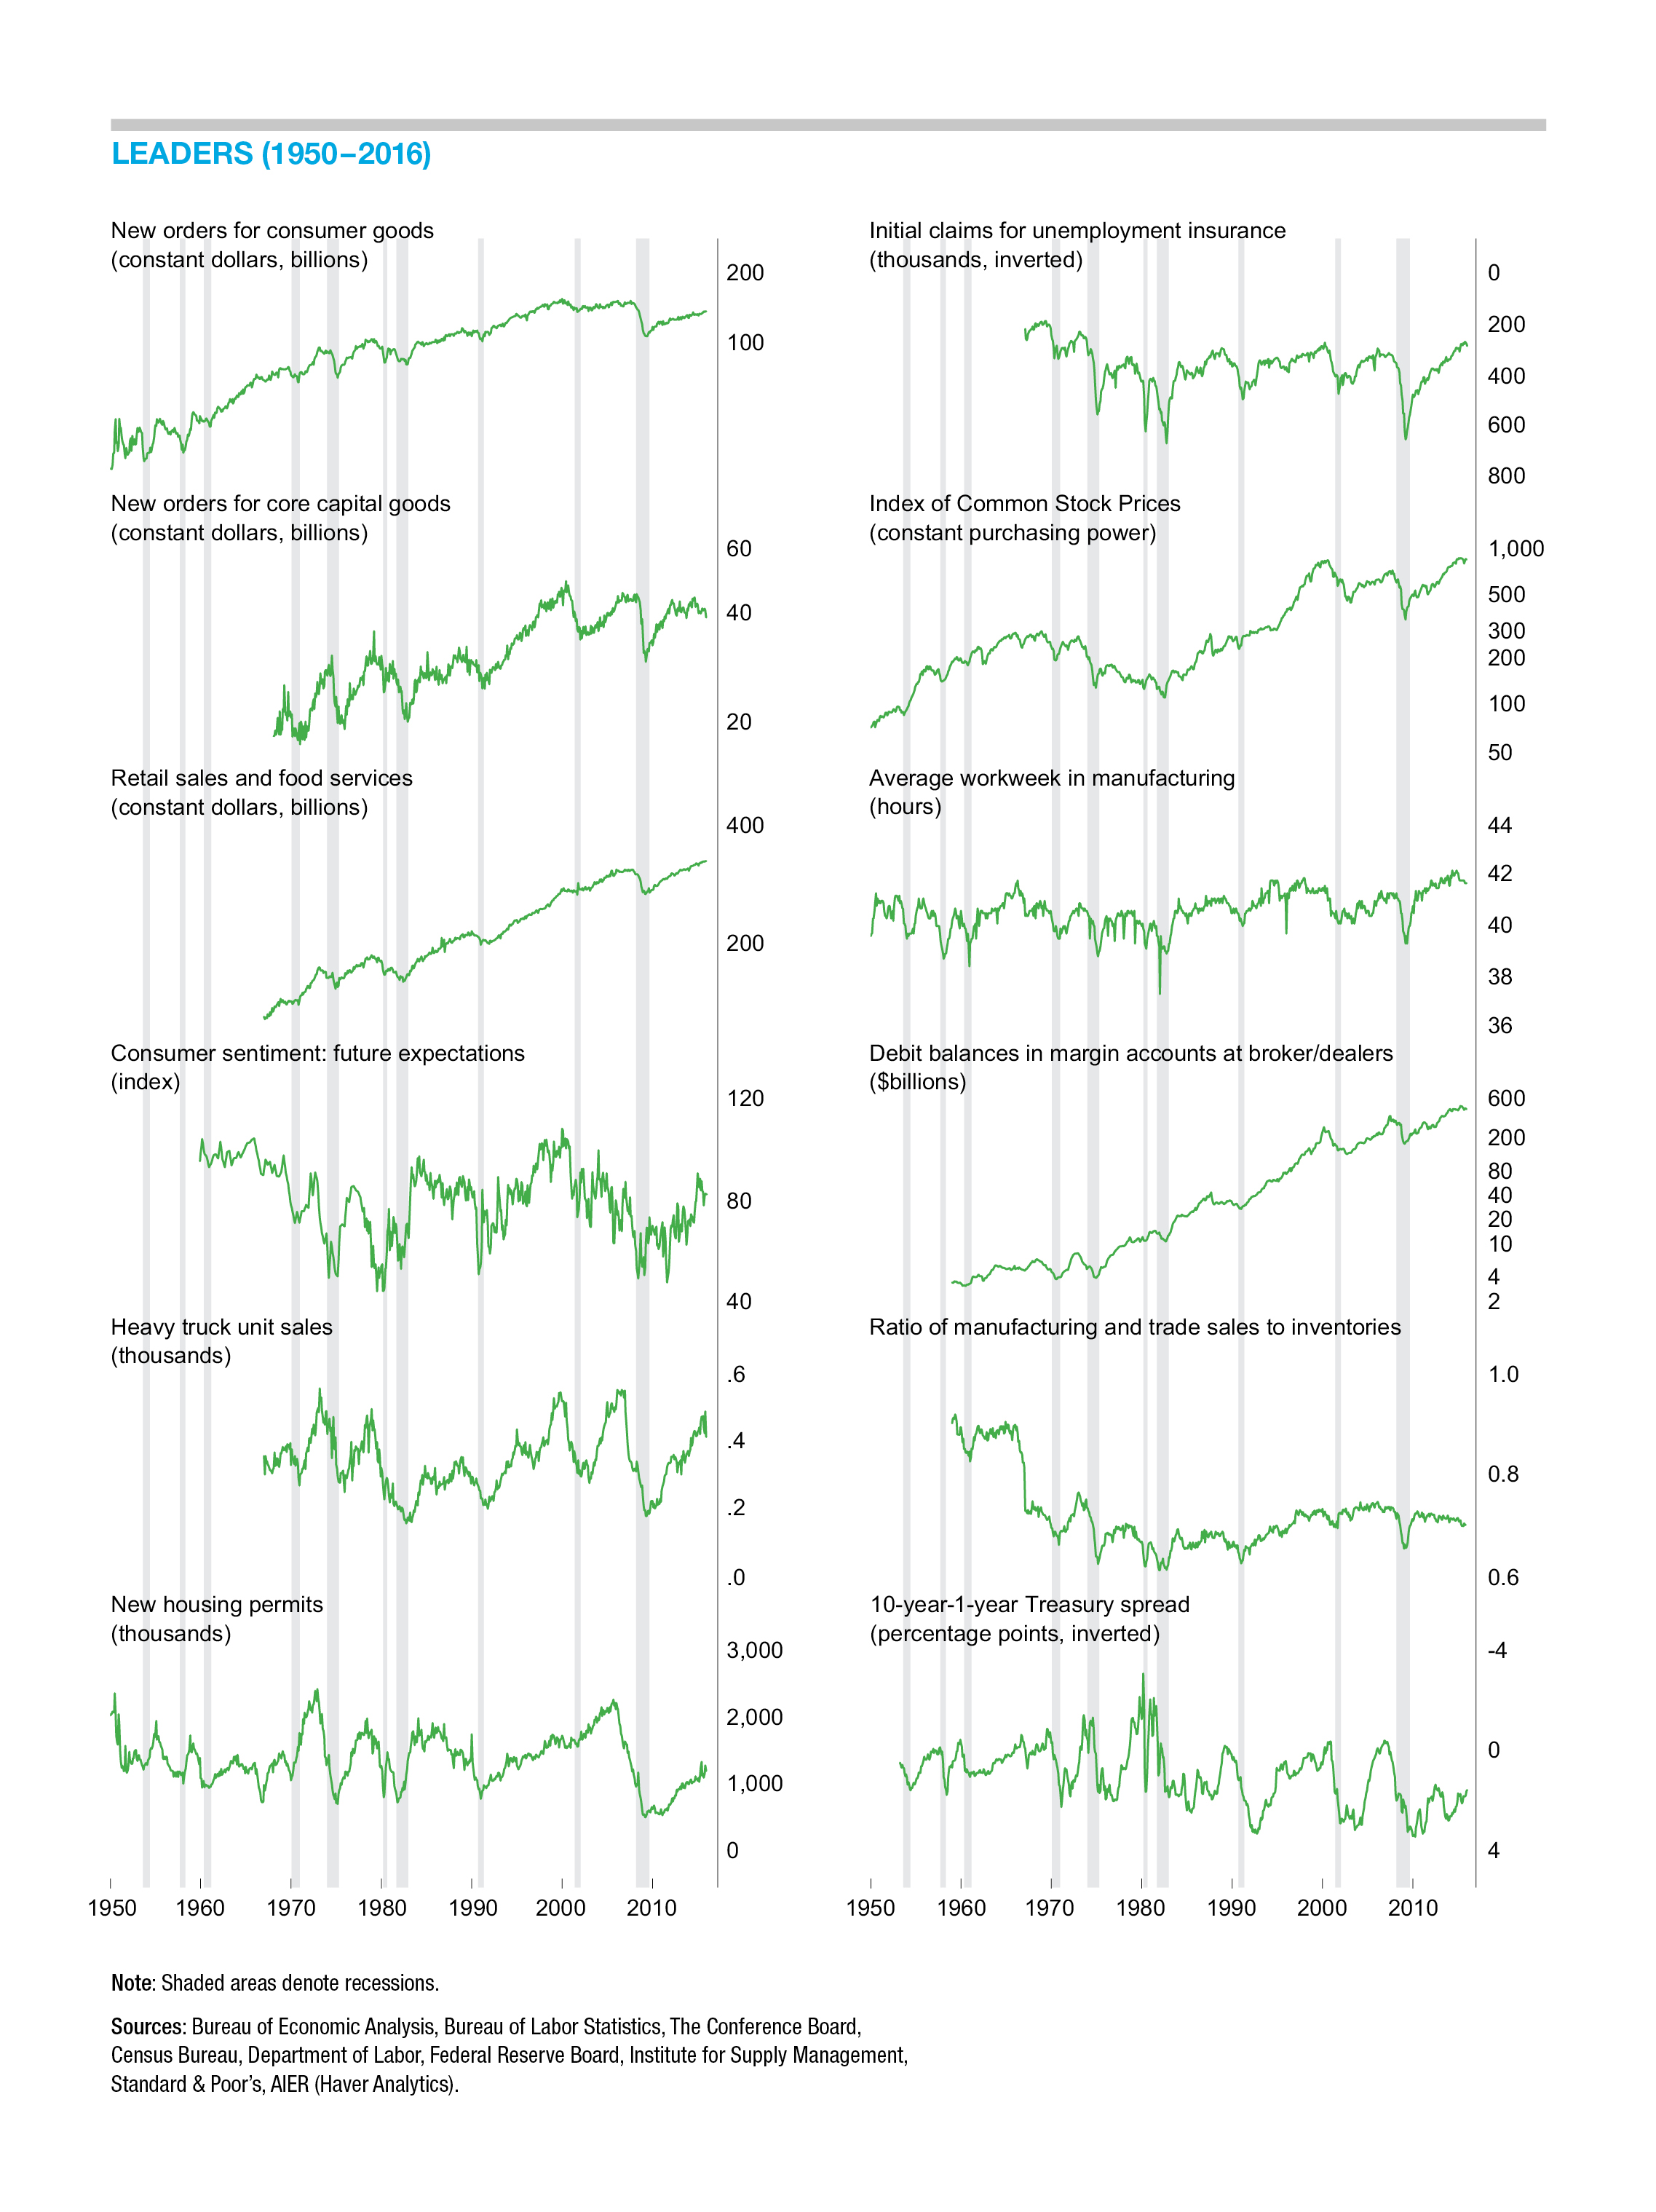
Five indicators changed direction in July, with four improving and one weakening. The improvements covered a wide range of areas in the economy including the labor market, business investment, housing, and financial markets. For the labor-related indicators, the improvement came in the average workweek in manufacturing. It moved up from a negative trend to a neutral trend in July. The other labor indicator, initial claims for unemployment insurance, maintained a positive trend for the month.
For the two business-investment-related indicators, real new orders for core capital goods improved to a positive trend in July from a neutral trend in June. Unit heavy-truck sales maintained its positive trend for the latest reading.
Housing permits improved to a neutral trend in the latest update thanks to a sharp rebound in permits for single-family homes as well as an increase in permits for multi-family structures.
Among the financial indicators, the 10-year–1-year Treasury yield spread improved to a positive trend, putting all three financial indicators into favorable status.
The one indicator to weaken in the latest update was consumer expectations about future economic conditions. While the weakening only pushed the indicator from a positive trend to a neutral trend, the weakening is notable given the continued high levels of consumer sentiment about current economic conditions. The weakening has been attributed to disappointment with the performance of politicians in Washington and the lack of progress on policy changes. With the upcoming federal debt-ceiling debate approaching, there is a reasonable probability that consumer sentiment about future economic conditions could deteriorate further in coming months.
The Coinciders index registered a perfect 100 for the fifth month, as all six of the indicators continued expanding. The five-month run of perfect readings is the first such run since December 2014 to April 2015. All six of the Coinciders are now showing strong expansion trends.
Our Laggers index fell again in July, posting a reading of 50 compared to 58 in the prior month. July’s drop was the fourth decline in the five months since the Laggers hit a level of 92 in January and February 2017. One indicator—real manufacturing and trade inventories—fell in July, switching from a neutral trend to a negative trend. Overall, two indicators are trending higher, two are now trending flat, and two are in a downward trend.
Economic Growth Reaccelerated in the Second Quarter
The initial estimate for second-quarter real GDP growth shows the economy expanded at a 2.6 percent annualized pace, up from 1.2 percent in the first quarter and 1.8 percent in the final quarter of 2016. Since 2010, the first full year of the current expansion, the annualized growth rate in real GDP is 2.1 percent. The improved growth in the second quarter was a result of stronger gains in consumer spending, particularly on durable and nondurable goods, and stronger gains in business investment in capital equipment.
All of the major subcategories of consumer spending on consumer durable goods showed either faster growth or, in one case, slower decline in the second quarter. In total, consumer durable goods spending accelerated from a 0.7 percent pace in the first quarter to a 4.7 percent annualized rate in the second quarter. The subcategories for consumer spending on nondurable goods were mixed, but overall spending on nondurables accelerated to a 3.8 percent pace versus 1.1 percent in the first quarter.
Spending on consumer services decelerated in the second quarter, rising at a 1.9 percent pace versus a 2.5 percent rate in the prior quarter. Still, consumer services contributed about 0.9 percentage points to overall GDP growth, but that is less than the 1.2 percent contribution in the prior quarter.
Overall, business investment slowed in the second quarter, posting a still-solid 5.2 percent gain versus a 7.2 percent rise in the first quarter, resulting in contributions to real GDP growth of 0.6 and 0.9 percentage points, respectively. Those were the strongest back-to-back contributions since 2014.
All three components of business fixed investment posted positive rates of growth in the second quarter, though two of the three, structures and intellectual-property products, decelerated in the quarter, from 14.8 percent to 4.9 percent and from 5.7 percent to 1.4 percent, respectively. Business investment in equipment accelerated from 4.4 percent growth in the first quarter to 8.2 percent growth in the second quarter. The solid pace for business investment combined with strong profits and cash flow and the positive trend in the core capital goods indicator in our Leaders index suggests that business investment may continue to be a positive contributor to economic activity in the months and quarters ahead.
Real residential investment fell at a 6.8 percent annualized pace in the second quarter, subtracting about 0.3 percentage points from overall growth. Without a significant pickup in demand, housing is likely to be only a minor contributor to economic activity as builders restrain the pace of growth of future activity in order to maintain a tight supply-demand balance.
Combined, consumer spending, business fixed investment, and residential investment grew at a respectable 2.7 percent pace in the second quarter.
Both real-export and real-import growth decelerated in the second quarter. However, export growth outpaced import growth, resulting in a net 0.2 percent contribution to real GDP from net trade. Stronger global growth and a somewhat weaker dollar may provide a tailwind for net trade in coming quarters.
The government sector reversed a 0.6 percent decline in the first quarter to post a 0.7 percent gain in the second quarter. The rise was led by a 5.2 percent increase in national defense spending, while nondefense fell 1.9 percent and state and local government spending fell 0.2 percent.
The Labor Market Posted Solid Gains in July
In addition to the accelerating growth in the second quarter, the early read on data for July suggests the economy is maintaining positive momentum. Among the most important of the early data sources is the July jobs report from the Bureau of Labor Statistics. According to the BLS, payrolls rose by 209,000 in July, the second consecutive monthly gain above 200,000. The 209,000-job gain follows a 231,000-job increase in June and 145,000-job increase in May. Over the past three months, payrolls have risen an average of 195,000, a very positive result.
Private-sector payrolls added 205,000 in July following increases of 194,000 in June and 153,000 in May. For the private sector, the three-month average increase comes in at a healthy 184,000. Notable among private-sector industries, manufacturing added 16,000 jobs for the month compared to a 12-month average gain of just 6,000.
Private services industries continue to lead in jobs creation, having added 183,000 jobs in July. Among the individual services industries, leisure and hospitality added 62,000 jobs for the month and a total of 346,000 over the past year; professional- and business-services payrolls rose by 49,000 last month and have added 580,000 workers over the past year; and health care added 45,000 employees in July, bringing the 12-month total to 430,000.
The unemployment rate fell to 4.3 percent in July, matching the low for the current expansion and below the 4.4 percent low of the prior expansion. Average hourly earnings rose 0.3 percent in July, maintaining the 12-month change at 2.5 percent. The length of the average workweek also held steady at 34.5 hours. Combined, the gains in payrolls, the hours worked, and the mild gain in hourly earnings resulted in a 4.5 percent increase in the aggregate payrolls index, a proxy for take-home pay. This index has been growing in the 4 to 4.5 percent range for most of 2011–17, which provides a solid base to support consumer spending.
Price Increases Remain Modest
The GDP price index, a broad measure of prices for all final goods and services, rose at a 1.0 percent annualized rate in the second quarter, down from a 2.0 percent pace in the first quarter. Over the past four quarters, the GDP price index has risen at a mild 1.6 percent.
The Personal Consumption Expenditure price index, the Fed’s preferred measure, rose 0.3 percent in the second quarter versus a 2.2 percent rise in the first quarter. Over the past four quarters, the PCE price index is up 1.6 percent. Price increases in the economy remain very mild by historical measures.
The more well-known Consumer Price Index rose 1.6 percent for the 12 months through June. Food prices in the CPI have risen 0.9 percent while energy prices have gained 2.3 percent. Excluding the food and energy components, core prices are up 1.7 percent over the past year.
Within the core, goods prices are down 0.6 percent for the last year and have risen at an annualized rate of just 0.1 percent over the last 20 years. That stands in sharp contrast to core services, which are up 2.5 percent over the past year and have gained an annualized 2.7 percent over the last two decades.
If the dollar weakens in the months and quarters ahead, higher import prices may flow through to consumer price measures. Likewise, higher labor costs, if not offset by productivity gains or other cost reductions, may eventually push consumer prices higher. For the moment, prices are nearly stable. However, vigilance against increases in the general price level is always a necessity.
[pdf-embedder url=”https://www.aier.org/wp-content/uploads/2017/08/BCM_August2017.pdf“]Robert Hughes

Robert Hughes joined AIER in 2013 following more than 25 years in economic and financial markets research on Wall Street. Bob was formerly the head of Global Equity Strategy for Brown Brothers Harriman, where he developed equity investment strategy combining top-down macro analysis with bottom-up fundamentals. Prior to BBH, Bob was a Senior Equity Strategist for State Street Global Markets, Senior Economic Strategist with Prudential Equity Group and Senior Economist and Financial Markets Analyst for Citicorp Investment Services. Bob has a MA in economics from Fordham University and a BS in business from Lehigh University.


