April Business Conditions Monthly


AIER’s Business Cycle Conditions Leading Indicators index reached a perfect 100 reading in March after coming in at 92 in February. The March result is the first 100 since January 2014. The Roughly Coincident Indicators index also registered a perfect 100, returning to that level for a third time in the past five months. The Lagging Indicators index improved for a third month, posting an 83 after a 67 in February and a 58 in January (see chart below). The strong March results suggest ongoing expansion and a low probability of recession in the months ahead.
The broad range of economic data suggests very solid momentum for the economy. However, significant concerns linger. First, with positive activity in most areas in the economy, few new sources of growth remain. Second, and perhaps more important, is recent developments in public policy. Tariffs and a trade war, rising deficits and government funding needs, and the potential for more aggressive Fed policy are all potential risks to economic expansion. Careful monitoring of policy developments and current economic conditions is warranted.
Leading indicators point to economic expansion
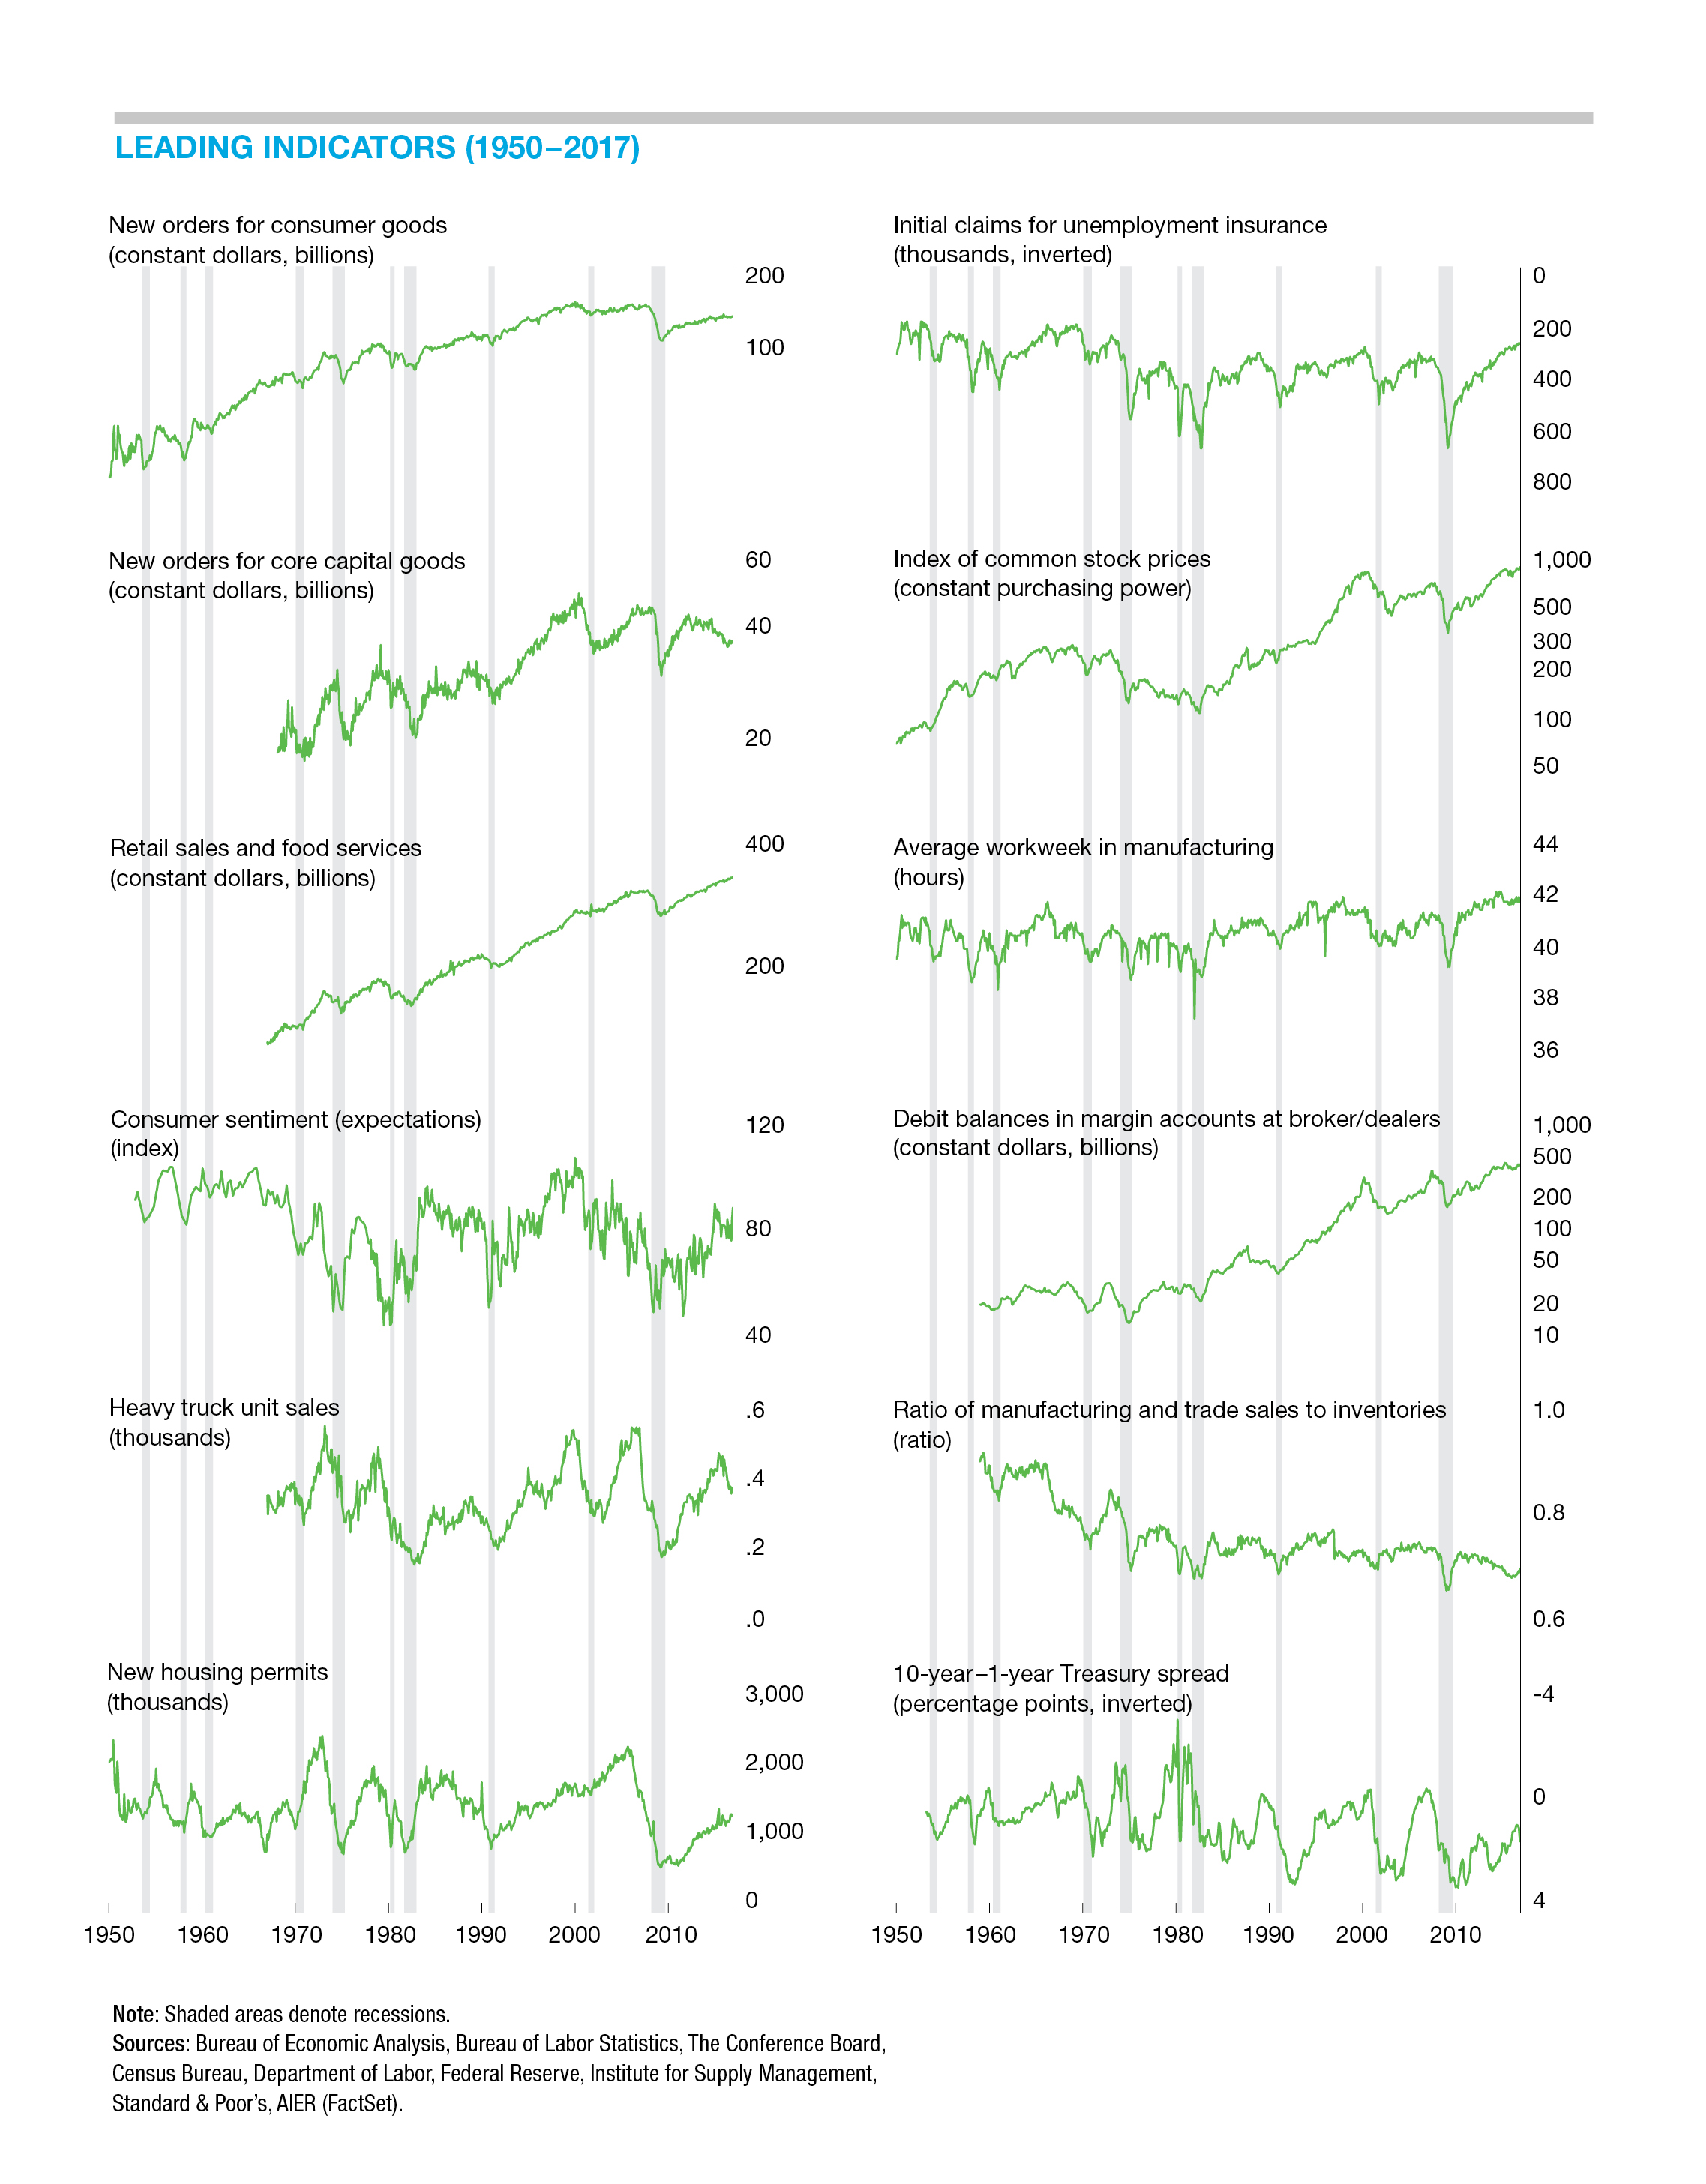
All 12 of the AIER leading indicators are trending higher. It is the first time since January 2014 that every indicator is showing expansion. The index has been at or above 75 for 16 consecutive months and at or above the neutral 50 level for 98 of the past 103 months. The three-month average rose to 93.3, the highest reading since October 2013.
Just one indicator changed sign in March. The average workweek in manufacturing jumped from a negative trend for February to a positive trend in March. The latest data show the length of the average workweek in manufacturing surged to 42.2 hours, matching an all-time high. This indicator previously hit an all-time high in 2014 but then pulled back during the economic slowdown of 2015. It regained some of the loss as the economy rebounded, hitting 42.0 in mid-2017.
It is very important to recognize that the average workweek is still quite long by historical measures, reflecting the renaissance in U.S. manufacturing in recent years. However, the natural bound for the length of the workweek limits the ability of this indicator to stay in a positive trend indefinitely. That makes it highly probable that this indicator will move to a flat trend or possibly a down trend over the next several months. As that happens, it will be important to monitor other indicators of manufacturing activity to determine whether this indicator is simply reflecting its natural bound or signaling something more significant.
The Coincident Indicators index returned to a perfect 100 reading in March. The index has hit the 100 mark 10 times in the past 13 months, dipping just slightly to 92 for January and February 2018 as well as October 2017. The 7-month run of perfect readings between March 2017 and September 2017 was the longest run since a string of 40 consecutive 100s from February 2012 through April 2015. One of the individual indicators, the employment–population ratio, changed signs in March, moving from a neutral trend to a positive trend.
AIER’s Lagging Indicators index posted a third consecutive monthly gain in March, hitting 83 in March versus 67 in February and 58 in January. Overall, four indicators are trending higher, none are trending lower, and two indicators are neutral. The Lagging Indicators index is likely to show further improvement over the coming months given the solid performance of the Coincident Indicators index.
Recent data round-up
Revised estimates show real GDP grew at a 2.9 percent pace in the fourth quarter compared to a 3.2 percent pace in the third quarter and 3.1 percent in the second. Real GDP rose 2.3 percent for all of 2017, versus a 1.5 percent rise in 2016 and 2.9 percent increase in 2015.
Private domestic demand, which is the sum of personal consumption expenditures, business investment, and residential investment (housing), surged to a 4.8 percent pace in the fourth quarter, the 32nd consecutive quarter of growth. Private domestic demand has been the main driver of growth for much of the current expansion. Fundamentals driving private domestic demand remain very solid and are likely to support healthy growth over the next several quarters.
After surging from September through November 2017, retail sales have posted three consecutive declines over the most recent three-month period. Even after the three declines, the level of retail sales is 3.3 percent above the level from six months ago. From a year ago, retail sales are up 4.0 percent.
Auto sales rose in March, posting a 17.48 million annualized rate for the month. Between 2000 and 2007, auto sales have generally trended in the 16 to 18 million annual rate. The selling rate fell to as low as nine million during the Great Recession. Since the end of the recession, auto sales have trended higher, returning to the 16 to 18 million range in 2014. Sales posted record results in both 2015 and 2016 before slowing sharply in the first eight months of 2017. Sales have since rebounded and are firmly in the 16 to 18 million range. It is also notable that since December 2013, the mix between cars and light trucks (SUVs and pick-up trucks) has shifted dramatically from about 50–50 to about 68 percent light trucks and 32 percent cars as of March 2018.
The labor market remains quite strong, with initial claims for unemployment insurance at an all-time low as a share of employment, new job creation averaging about 188,000 new jobs per month over the last 12 months, the unemployment rate hovering at 4.1 percent for the sixth straight month in March, and the number of open jobs totaling 6.3 million as of January 2018, a series high.
The strong labor market has helped support very high levels of consumer sentiment, especially toward current economic conditions. Opinion surveys from The Conference Board and the University of Michigan show attitudes regarding current economic conditions are at their highest in about 20 years. Opinions regarding future economic conditions are not quite as high but are still near the highest levels in a decade.
Consumer-debt growth has been accelerating in recent months, with revolving consumer credit up 6.1 percent from a year ago and non-revolving debt up about 5 percent. Combined, total consumer credit is up about 5.3 percent over the past 12 months. Those growth rates are about in line with median rates over the last two decades.
Despite the growth in debt, overall debt service has risen only slightly since hitting a multi-decade low in the fourth quarter of 2012. The basic debt-service ratio (minimum monthly principal and interest payments as a share of disposable income) was 9.9 percent at the end of 2012, down from a peak of 13.2 percent in the fourth quarter of 2007. As of the fourth quarter of 2017, the debt-service ratio stood at 10.3 percent. A broader measure, the financial-obligations ratio, which includes traditional debt service as well as leases, rent, homeowners’ insurance, and property taxes, hit a low of 15.0 percent at the end of 2012, down from 18.1 percent at the end of 2007. As of the fourth quarter, that ratio was 15.9 percent. The combination of rising debt levels and rising interest rates could push this ratio up more sharply in coming quarters, but as of now, both ratios remain relatively low.
Capital-goods spending has been improving since mid-2016. As a component of real gross domestic product, capital goods (nonresidential fixed investment) has made a positive contribution to growth for seven consecutive quarters, including additions of at least 0.5 percentage points in each of the last four quarters. New orders for capital goods came in at an $87.7 trillion annual rate in February, up from $67.2 trillion in June 2016. The less volatile category of nondefense capital goods excluding aircraft came in at $67.7 trillion in February, up from $59.9 trillion in May 2016, a 13 percent increase.
Healthy gains in consumer spending and capital investment have pushed total industrial-production growth up to 4.3 percent for the 12 months through February, up from −4.0 percent in December 2015. Some of that gain has come from utility and mining output. Core manufacturing output is up 2.4 percent over the past year, up from a 1.9 percent decline in November 2015. The latest survey of manufacturing companies conducted by the Institute for Supply Management shows manufacturing activity, production, new orders, and hiring are still expanding as of March, though the pace may have slowed just slightly.
Overall, the large preponderance of data shows the U.S. economy is growing at a very solid pace supported by private domestic demand and a robust labor market. Despite these data, risks remain.
Policy risks looming
Tariffs and trade
President Trump’s initiative to impose tariffs on Chinese imports has resulted in a set of retaliatory tariffs on several categories of U.S. exports to China. The list of goods subject to new Chinese tariffs was carefully selected to hit Trump supporters.
Truly free and fair trade is a win-win policy. However, in the real world, trade deals are usually far from free or fair. A clear sign of trouble is a persistent, substantial trade imbalance. Attempting to correct such persistent imbalances is admirable but not without short-term risks.
Exports have been growing at about a 5 percent pace annually since early 2017. That growth has contributed between 0.06 and 0.21 percentage points to real GDP growth over the last four quarters. In addition to the risks to U.S. export growth, U.S. products manufactured and sold abroad (and the profits generated) could be at risk if global sentiment turns against the United States and U.S. goods and services.
Federal deficits and debt
The second significant policy risk for the economy is the rapidly deteriorating federal fiscal position. Budget and deficit projections are worsening. Projected debt levels for the United States are rising. The negative implications for the long-term health of the economy have been expounded on but to no avail. There are significant shorter-term risks as well. The federal government is expected to have substantial capital needs later this year. Large debt auctions have the potential to raise long-term interest rates, threatening the growth of interest-rate-sensitive areas of the economy.
Monetary policy
Finally, monetary policy has the potential to disrupt economic growth later in 2018 and into 2019. The latest set of Summary Economic Projections shows Fed members have generally marked up their view of the economy, boosting their expectations for real GDP growth and increases in price measures while lowering their expectations for the unemployment rate. Along with the greater optimism, expectations for the future path of the federal funds rate were higher through the 2020 outlook period.
Monetary-policy normalization has been on an exceptionally slow path throughout the expansion. So far, that policy path appear to have been broadly appropriate, but a more aggressive path could restrain economic growth just as the potential headwinds from slower exports and fiscal problems hit.
[pdf-embedder url=”https://www.aier.org/wp-content/uploads/2018/04/BCM_April_2018.pdf“]Robert Hughes

Robert Hughes joined AIER in 2013 following more than 25 years in economic and financial markets research on Wall Street. Bob was formerly the head of Global Equity Strategy for Brown Brothers Harriman, where he developed equity investment strategy combining top-down macro analysis with bottom-up fundamentals. Prior to BBH, Bob was a Senior Equity Strategist for State Street Global Markets, Senior Economic Strategist with Prudential Equity Group and Senior Economist and Financial Markets Analyst for Citicorp Investment Services. Bob has a MA in economics from Fordham University and a BS in business from Lehigh University.


