Apparel Prices Jump for a Second Consecutive Month

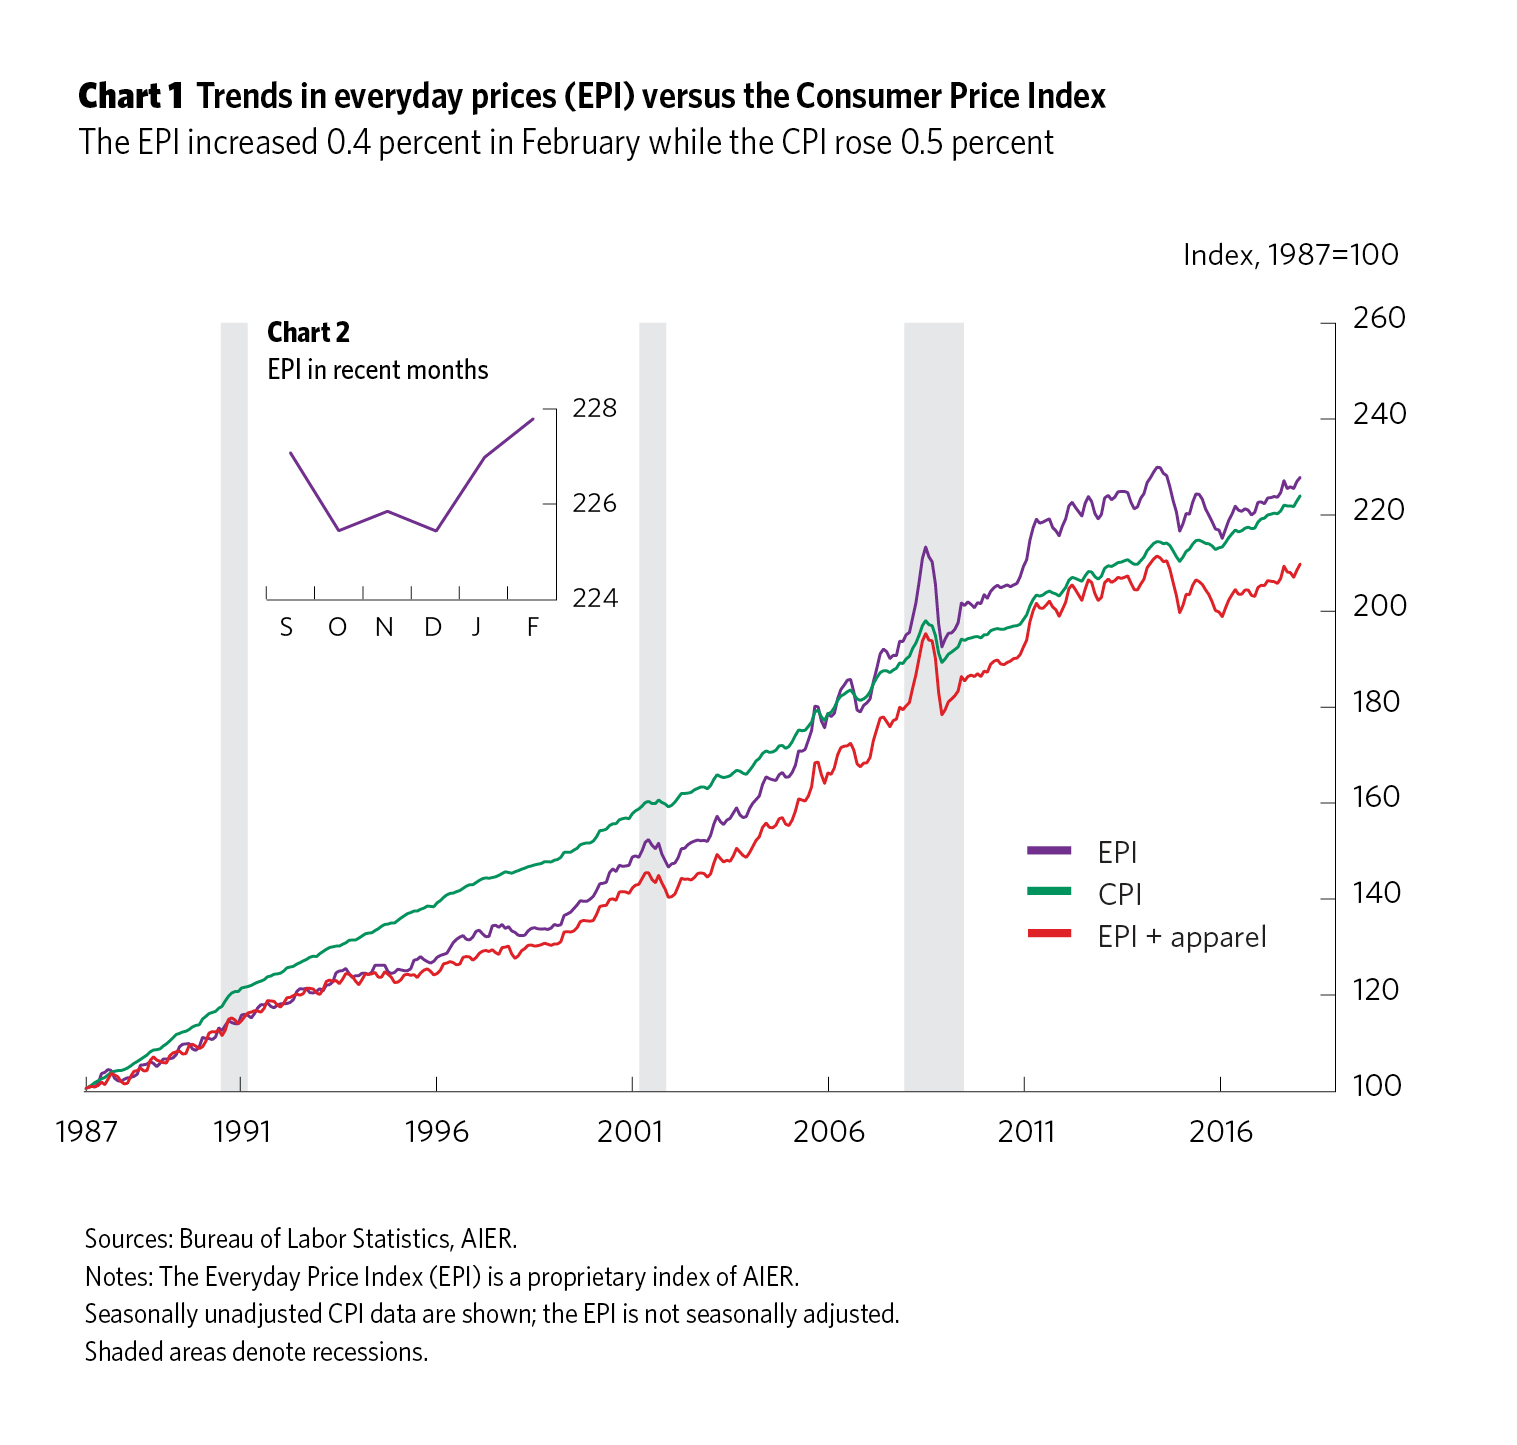
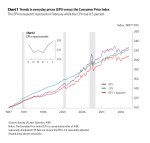
AIER’s Everyday Price Index (EPI) jumped 0.4 percent in February following a 0.7 percent surge in January. The EPI measures price changes people see in everyday purchases such as groceries, restaurant meals, gasoline, and utilities. As a comparison, the more widely known price gauge, the Consumer Price Index (CPI), which is reported by the Bureau of Labor Statistics and includes less frequently purchased items, was up 0.5 percent in February. The EPI is not seasonally adjusted, so we compare it with the unadjusted CPI.
Over the past 12 months, the EPI has risen 2.3 percent while the CPI is up 2.2 percent. Over the last five years, the EPI is up at an annualized rate of just 0.4 percent and the CPI is up 1.4 percent.
The EPI including apparel, a broader measure, gained 0.6 percent in February after a 0.7 percent increase in January. Apparel prices were a significant contributor, jumping 3.5 percent in February and 1.4 percent in January on a not-seasonally-adjusted basis. Those gains added 0.28 and 0.11 percentage points respectively to the monthly changes in the EPI including apparel. Over the two-month period, apparel prices are up 5.0 percent.
On a seasonally adjusted basis, apparel prices increased 1.7 percent in January and 1.5 percent in February, resulting in a two-month gain of 3.15 percent, the largest two-month gain since 1990. Apparel prices have been generally weak for most of the past two decades, with the exception of brief periods in 1997 and 2009 and a somewhat longer period from mid-2011 through mid-2014. Over the last 20 years, apparel prices have fallen at an annualized rate of −0.3 percent.
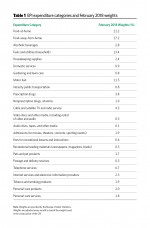
It will be interesting to see whether there will be persistent increases in apparel prices or the monthly gains are just isolated bumps. However, apparel has a weight of just 3.04 percent in the total CPI and 8.0 percent weight in the EPI including apparel, so it is unlikely to be a significant driver of overall price inflation.
Energy and food have the largest weightings in the EPI including apparel, at 22.9 percent and 35.3 percent respectively. Increases in prices for food at home (groceries) have been quite tame in recent years, rising 0.5 percent over the past 12 months and 0.5 percent at an annual rate over the past five years. Restaurant prices have been rising more quickly, up 2.6 percent over the past year and 2.5 percent annually over the past five years. Energy prices are extremely volatile, rising 7.7 percent over the past year but falling at a 2.1 percent annual pace over the past five years.
The key take-away is that food and energy remain the primary contributors to changes in everyday prices, but apparel prices have been a key contributor in February and January.


