Home-Price Increases Are Accelerating; Initial Claims Remain Low

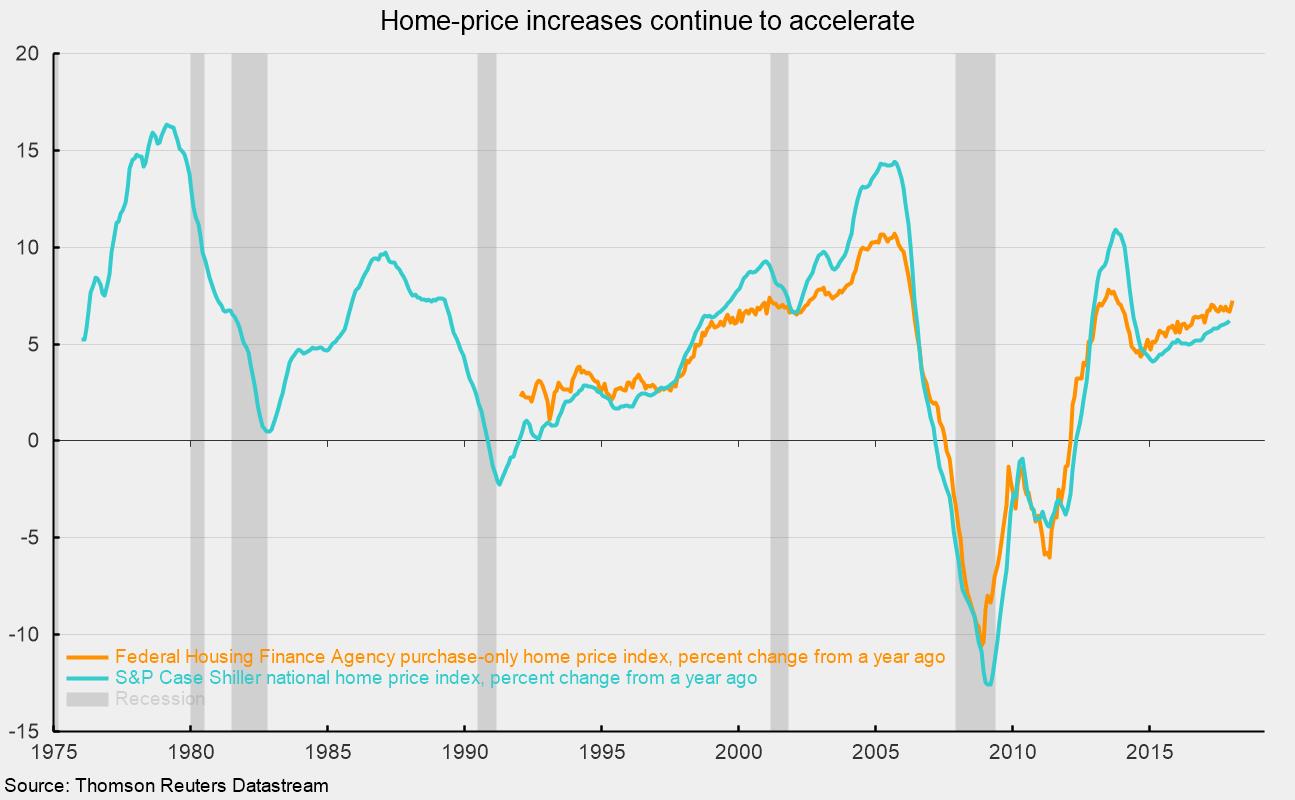
A tight supply of existing homes for sale combined with strong consumer fundamentals that are supporting demand is pushing home prices up at an accelerating rate. The home-price index for purchases from the Federal Housing Finance Agency rose 7.3 percent from a year ago, the fastest pace since October 2013 (see chart). The purchase-only price index has been accelerating since hitting a recent low of 4.3 percent in September 2014. The performance of the index broadly aligns with the performance of the S&P Case Shiller national home-price index, which has been accelerating since hitting a recent low of 4.1 percent in February 2015. The pace of increase for both indexes is still below the double-digit rates seen at the height of the housing bubble in 2005.
The Federal Housing Finance Agency provides detailed pricing information for nine regions within the United States: East North Central, East South Central, middle Atlantic, mountain, New England, Pacific, South Atlantic, West North Central, and West South Central. All regions show a similar pattern of accelerating price increases over the past two years. The fastest growth has been in the mountain and Pacific regions, posting 12-month increases of 10.0 and 9.4 percent respectively. The South Atlantic region also has a 12-month increase above the national average, rising 7.8 percent. The East North Central, East South Central, and middle Atlantic all had 12-month increases in the 6 to 7 percent range while the West North Central and West South Central regions posted the slowest increases, at 5.8 percent and 5.1 percent respectively.
Strong consumer fundamentals are likely to continue to support demand for housing, though rising interest rates may become something of a headwind over time. Homebuilder sentiment remains at very high levels, and though the months’ supply for new homes on the market is higher than the months’ supply for existing homes, the much smaller new-home category benefits from the tight existing-home market by providing an extra bit of demand from buyers that might have been looking to purchase an existing home but could not find a suitable prospect.
Initial claims for unemployment insurance remain at historically low levels. For the week ending on March 17, initial claims were 229,000, up 3,000 from the prior week. The four-week average came in at 223,750, up 2,250 from the prior week. The level of initial claims is at the lowest levels since the 1970s. Measured as a percentage of employment, initial claims continue to run at all-time lows. Furthermore, there are 6.3 million openings across the country as of January and the unemployment rate is holding at 4.1 percent, the lowest since 2000.
Overall, data continue to suggest positive momentum in the economy with a low probability for recession in the coming months and quarters.
Robert Hughes

Robert Hughes joined AIER in 2013 following more than 25 years in economic and financial markets research on Wall Street. Bob was formerly the head of Global Equity Strategy for Brown Brothers Harriman, where he developed equity investment strategy combining top-down macro analysis with bottom-up fundamentals. Prior to BBH, Bob was a Senior Equity Strategist for State Street Global Markets, Senior Economic Strategist with Prudential Equity Group and Senior Economist and Financial Markets Analyst for Citicorp Investment Services. Bob has a MA in economics from Fordham University and a BS in business from Lehigh University.