We Are Measuring Inflation All Wrong: Non-Housing Inflation is Very Low


The Bureau of Labor Statistics measures changes in housing costs in ways that change slowly and arrive too late. Studies from the BLS, Federal Reserve Banks and prominent economists find lags of 12-18 months before changes in rents and/or house prices finally get reported as higher or lower housing inflation in CPI or PCE inflation reports.
CPI shelter (housing) consists of periodic surveys of old and new leases, so the old ones turn over slowly. Owner’s Equivalent Rent (OER) uses rent survey data to fabricate an inherently implausible average estimate of what millions of owned homes could have been rented for. OER alone is a fourth of the CPI, and OER plus rent means shelter accounts for 34 percent of the CPI and 42 percent of Core CPI.
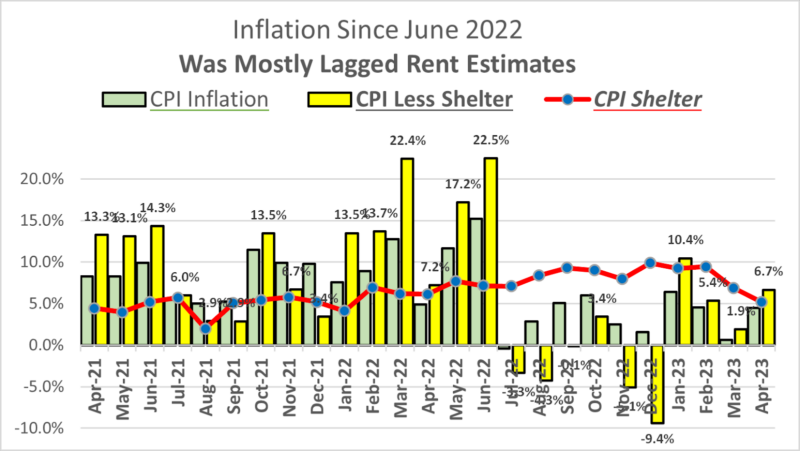
A long data lag makes these overweighted housing inflation estimates so misleading the Fed Chairman Powell has warned against measuring inflation services without first removing housing. If we look at “CPI less shelter,” the average annual rate of inflation over the past ten months was 0.6 percent. And the producer price index (PPI) – which also excludes housing – rose at a similar 0.9 percent rate.
The Fed and media define inflation as each month’s increase from a year earlier. But that 12-month average remains exaggerated because annualized inflation rates in May and June of 2022 were 11-14 percent, partly due to the Russia-Ukraine invasion. Once we drop those oldest and most extreme months out of the 12-month year-to-year average, CPI inflation falls to 3.3 percent for the past ten months rather than 4.9 percent for twelve.
Before that, from April 2021 to June 2022, CPI inflation averaged 8.6 percent. Getting inflation down from 8.6 percent to 3.3 percent belies the cliche about inflation being sticky or stubbornly high. Yet that 3.3 percent figure drops much further – to 0.6 percent – if we exclude shelter.
Why exclude shelter from the CPI? Because the numbers are wrong.
Energy prices in April were down 4.9 percent from a year earlier, but shelter prices were up 8.1 percent. The Fed and the Fed press corps want to remove food and energy from the CPI, but doing that makes shelter 42 percent of that shrunken “core” index. Yet energy prices really are much lower than a year ago, while home prices or rents are definitely not rising at an 8.1 percent rate as published CPI figures suggest.
Fed Chairman Jerome Powell explained the reason for excluding housing from inflation statistics in a November 30, 2022 speech at the Brookings Institution:
Housing inflation tends to lag other prices around turning points. . . because of the slow rate at which the stock of rental leases turns over. The market rate on new leases is a timelier indicator of where overall housing will go over the next year or so. Measures of 12-month inflation in new leases rose to nearly 20 percent during the pandemic but have been falling sharply since about mid-year. . . However, overall housing services inflation has continued to rise as existing leases turn over and jump in price to catch up with the higher level of rents for new leases. And this is likely to continue well into next year. But as long as new lease inflation keeps falling, we would expect housing services inflation to begin falling sometime next year.
Excluding archaic rent and OER figures is an excellent suggestion. But correcting the figures only for services would leave the rest of CPI tainted. Housing less rent amounts to only 26.5 percent of the CPI. And it slowed to a 2.7 percent rate of increase since November – below than 3.3 percent average from 1986 to 2020. If it makes sense to exclude lagged shelter estimates from services sector inflation, how could it not also make sense to exclude shelter from the entire CPI?
Lagged OER and rent overstated inflation by more than two percentage points over the past ten months – raising it to 3.3 percent from 0.6 percent.
Before that, lagged OER and rent understated inflation by nearly three percentage points from the time of the March 2021 stimulus checks to June 2022 – lowering apparent inflation with housing included to 8.8 percent from a non-housing rate of 11.5 percent. Lagged rent and OER held down reported inflation in 2021 to early 2022 because BLS estimates were then reflecting, with a lag, the soft housing market during the pandemic lockdowns from March 2020 to February 2021.
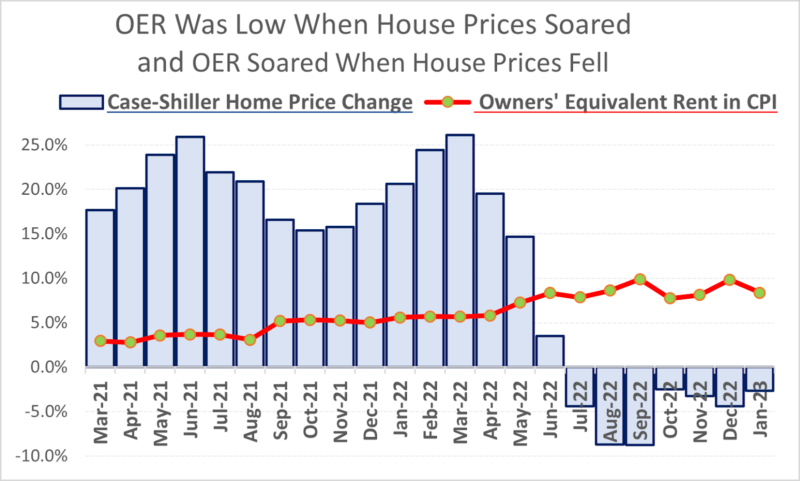
Since July 2022, by contrast, when home prices and rent began to fall, OER and rent in the CPI rose higher than ever, adding bogus monthly housing inflation estimates of 9 percent or more to the CPI and PCE. Lagged BLS methods made inflation and core inflation look much higher than the underlying non-housing inflation (that Chair Powell recommends for services).
The first graph shows how detached OER became from the S&P Case-Shiller index of home prices.
Numerous serious studies have shown that housing inflation numbers in CPI and PCE reports have been lagging 12-18 months behind actual market rents and home prices:
- An October 2022 Bureau of Labor Statistics paper also found that “rent inflation for new tenant leads the official BLS rent index by 4 quarters.”
- A 2022 study co-authored by Larry Summers found that, “Year-over-year growth in OER, either in the CPI or PCE, correlates most strongly with the 16- and 12-month lags of home prices and private sector rents, respectively.”
- A Boston Fed study uses market information from older leases to project (due to lags) that “CPI shelter will grow 5.9 percent from September 2022 to September 2023 and then 3.9 percent over the subsequent 12 months. These numbers suggest that CPI shelter will remain [artificially] elevated.”
Because OER alone is a fourth of the CPI, the easiest way to fix the huge data lag problem is to remove OER from our measures of inflation – as other countries do. The Bank of England does not include OER in its inflation target. The European Central Bank monitors the EU “harmonized index of consumer prices” (HICP) which excludes OER.
What would happen if the U.S. kept rent in the CPI but removed the much larger OER errors, as the EU does? Answer: The Harmonized Index of Consumer Prices for the United States rose at a 1.3 percent annual inflation rate from July 2022 to April 2023.
If the Fed had been targeting the same sort of consumer price index that European central banks do, they could have stopped raising overnight interest rates on bank reserves long before the federal funds rate rose dangerously far above the yield on 10-year bonds. Keeping the yield curve inverted for six months risks a hard landing needlessly because, if we simply avoid being deceived by misleading OER and rent estimates, inflation has come down quite rapidly since last June.
Alan Reynolds

Economist Alan Reynolds is a senior fellow at the Cato Institute, and former vice president of the First National Bank of Chicago. He served as research director with Jack Kemp’s 1995-96 Tax Reform Commission, and with Larry Kudlow and Alan Greenspan as a member of President Reagan’s 1981 transition team. He is a former columnist with Forbes, Reason, and Creators Syndicate. He is also a past member of the Blue Chip and Wall Street Journal forecasters.
Author of the 2006 book Income and Wealth, Alan Reynolds has written for countless publications since 1971, including the Wall Street Journal, New York Times, Harvard Business Review, The Public Interest, National Review, Regulation and The Cato Journal.