Vehicle Sales Fell in April, and Credit Card Debt Shrank in March

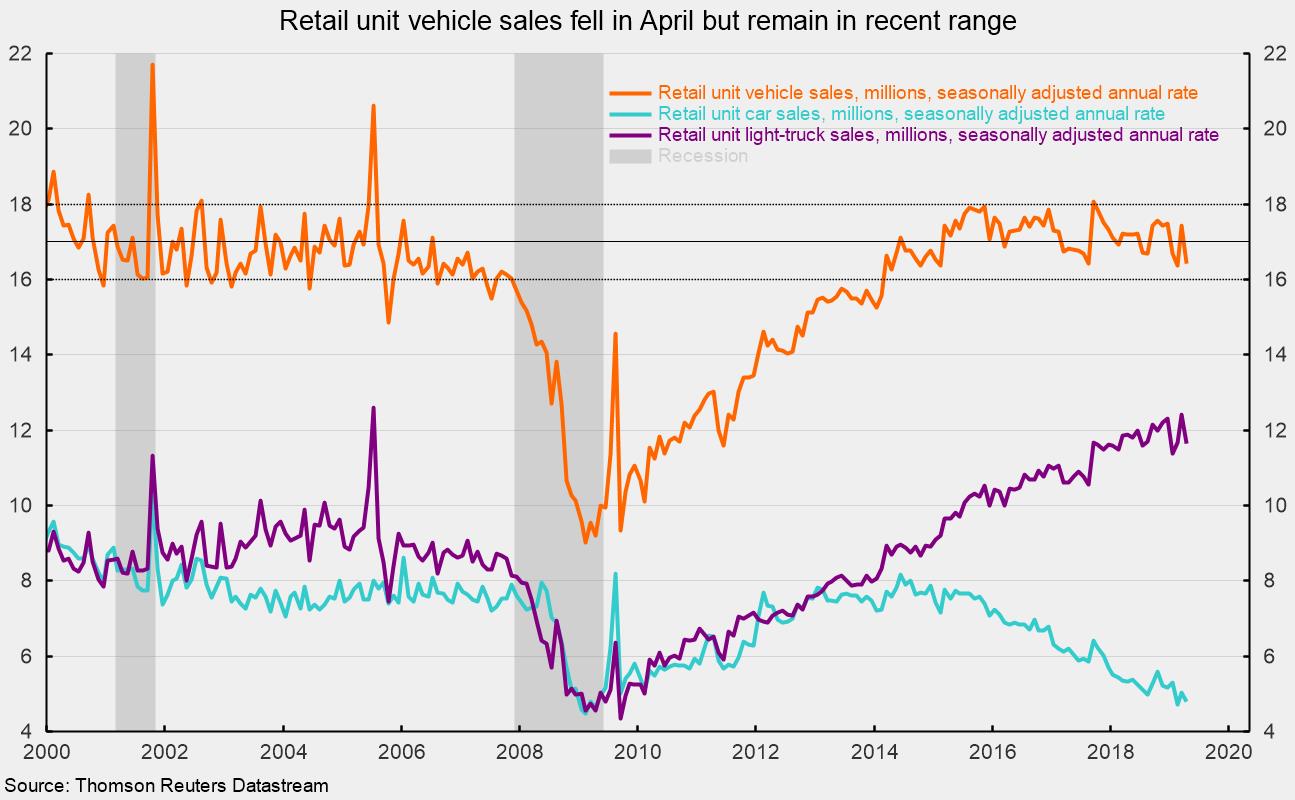
Sales of light vehicles totaled 16.4 million at an annual rate in April, down from a 17.4 million pace in March (see chart). Despite the drop, the pace of sales remains within the 16 to 18 million-unit range that we have seen for much of the past two decades. Unit vehicle sales fell significantly below the range as the 2008–9 recession began, hitting a low of just 9.0 million in February 2009. Sales began a slow recovery and returned to the 16 to 18 million range in March 2014 and have remained there for 62 consecutive months.
Beginning in 2013, the composition of light-vehicle sales has shifted dramatically. In February 2013, the split between cars and light trucks (SUVs and pick-up trucks) was about even, with both segments selling about 7.76 million at an annual rate. That was the last time the shares were close to equal. As of April 2019, light-truck sales totaled 11.6 million at an annual rate while cars managed just 4.8 million, less than half the pace of light-truck sales and just a 29 percent market share (see chart).
The strong labor market, rising incomes, and generally favorable levels of consumer confidence are likely to support consumer spending over the coming months. Retail vehicle sales appear set to maintain a pace in the 16 to 18 million range and light trucks are likely to continue to dominate car sales.
The strong labor market and solid income gains are making it easier for consumers to spend out of current cashflow without relying on credit cards. Revolving credit outstanding fell $2.2 billion, or a $26.2 billion annual rate, in March, the fifth drop in the last 13 months. Total revolving credit outstanding was $1,057.2 billion, down from $1,059.4 billion in February.
The drop in revolving credit (primarily credit cards) was not enough to offset the $12.5 billion increase in nonrevolving credit. Total nonrevolving credit outstanding rose to $2,994.9 billion from $2,982.5 billion in February. Within nonrevolving credit, student loans totaled $1,598.1 billion, or about 53 percent, while auto loans totaled $1,161.1 billion, or 39 percent. Together, they account for 92 percent of nonrevolving debt outstanding.
Combined, revolving and nonrevolving consumer debt outstanding rose to $4,052.1 billion versus $4,041.8 billion in February, a 3.1 percent annualized growth rate. From a year ago, total consumer credit is up 4.9 percent, well below the 25-year annualized pace of 6.2 percent.
Overall, consumer-credit growth remains modest by historical comparison. Student loans remain a major driver, but even its pace of growth has slowed somewhat versus the pace from 2011 through 2015.
Robert Hughes

Robert Hughes joined AIER in 2013 following more than 25 years in economic and financial markets research on Wall Street. Bob was formerly the head of Global Equity Strategy for Brown Brothers Harriman, where he developed equity investment strategy combining top-down macro analysis with bottom-up fundamentals. Prior to BBH, Bob was a Senior Equity Strategist for State Street Global Markets, Senior Economic Strategist with Prudential Equity Group and Senior Economist and Financial Markets Analyst for Citicorp Investment Services. Bob has a MA in economics from Fordham University and a BS in business from Lehigh University.


