US vs. Denmark: Which Country Wins?


During the past sixty years the Nordic model of economic and social development has been praised for its inclusiveness, especially when compared to the US. Their high-tax, high-welfare system appears to deliver.
Danes, for example, live 1.5 years longer than their American counterparts.
What has been the economic cost of these social policies? To investigate, I will compare the US with Denmark. 1960 is a good place to start since at that stage Danish tax, as a percentage of GDP, was 25%, 2 percentage points below the level in the United States. Appearances can be deceptive; back in 1960 the average Dane paid lower taxes and lived 2.4 years longer than the average American.Follow some simple economic comparisons:
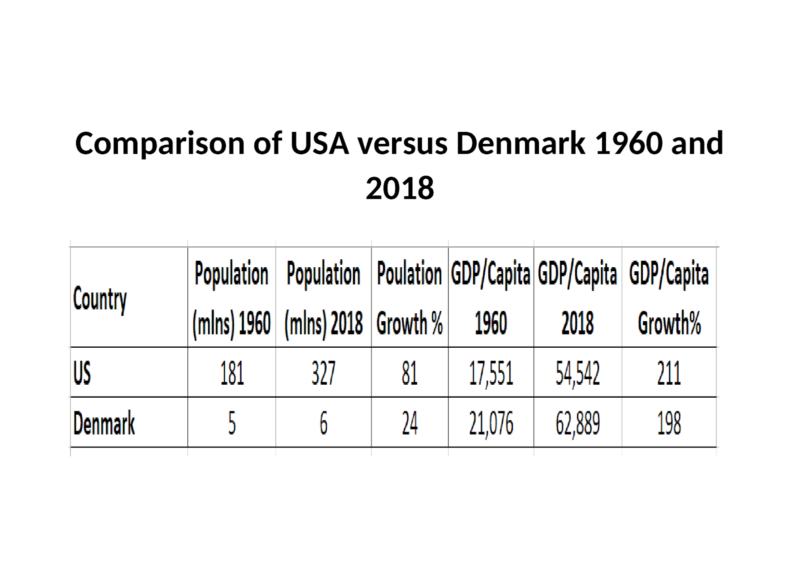
The table above is, of course, an over-simplification; as an economic gauge of societal well-being GDP growth is certainly not without its flaws. What it does show is that whilst Denmark has grown its per capita GDP by roughly the same pace as the United States, its population has grown at a much lower rate. In other words, the rate of growth of the US economy has allowed it to sustain an 80% expansion in its population whilst Denmark has been able to sustain only a 20% increase over the same 58-year period. Looked at another way, Danish per capita productivity (which is not quite labour productivity) has outpaced that of the US by a considerable degree.
Productivity
Before declaring the contest over, it must be said that productivity is difficult to measure, especially as developed economies transform from manufacturing to services. Focussing on the past decade, a recent Bruegel article asks, ‘Could the U.S. economy be experiencing a hidden tech-driven productivity revolution?’ The author notes the slowing of productivity in the wake of the financial crisis and discusses the demographic forces which he believes are largely to blame. He adds that a combination of higher immigration and later retirement would offset the demographic impact of an aging population, but admits neither policy is politically popular.
Then the author asks, ‘Is actual technological progress under-measured?’ A question the US economist, Robert Solo, also posited back in the 1980’s. There is no empirical evidence for under-measurement but given that productivity is normally measured in Dollars, Euros or Krona, the incredible deflationary forces at work in the technology sector may well be the source of this mismeasurement. Here is the productivity formula:
Whilst simple enough to calculate, the equation fails to account for improvements in quality. Just look at your cell phone and consider what it looked like a decade ago. Then consider how much more (or less) you would have to pay for this item today.
The solar panel provides a further example. As mass production has reduced output costs, prices have fallen by more than 90%. Meanwhile technological improvements have seen the conversion rates of the average panel improve more than 10-fold. The true cost of turning solar energy into electricity has fallen by more than 99%. A huge productivity gain, except when measured in unit value.
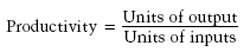
Labour productivity is easier to interpret. The chart below reveals how it has stagnated in developed countries during the last 15 years. US productivity increased by 1.3% per annum between 2005 and 2016, versus 2.8% annually between 1995 and 2004. The EU was even more severely afflicted.
Driven by technology, the era of flexible employment that had already began with the Great Recession merely accelerated the process. How many consultants do you know who earn more than they did when fully-employed? Then consider the impact on labour productivity.
Total Factor Productivity has followed a similar trajectory, as the next chart reveals:
The ‘modern productivity paradox’ as it has been dubbed, has given rise to four distinct theories: –
False hopes
The benefits of technology are overstated. This argument is countered by the history of innovation which shows the long lead time between the invention and the productivity boost.
Mismeasurement
A great example of this deficiency in our ability to objectively measure productivity is presented by Google, Chief Economist, Hal Varian: –
In 2000, there were 80 billion photos produced. We know that because there were only three companies that produced film. And fast-forward to 2015, there are about 1.6 trillion photos produced. Back in 2000, photos cost about 50 cents apiece. Now they cost zero a piece essentially. So any ordinary person would say, wow, what a fantastic increase in productivity, because we’ve got a huge amount of more output and we’ve got a much, much lower cost. But if we go look at that from the GDP lens, it doesn’t show up in GDP for the most part because those photos are typically traded among friends and put in albums and things like that. They’re not sold on the market. GDP is the market value of transactions out there, and anything that’s not sold or has a zero price isn’t going to show up in GDP.
The contrary view is that this mismeasurement argument is not sufficiently widespread to explain the broad-based decline.
Unfair distribution of benefits
The benefit accrues to a small number of large corporations. Without broad-based adoption, productivity gains are stifled. At the risk of being castigated as an optimist, if this theory gains credence, the competition authorities should ride to the rescue in the decades ahead.
Implementation lags
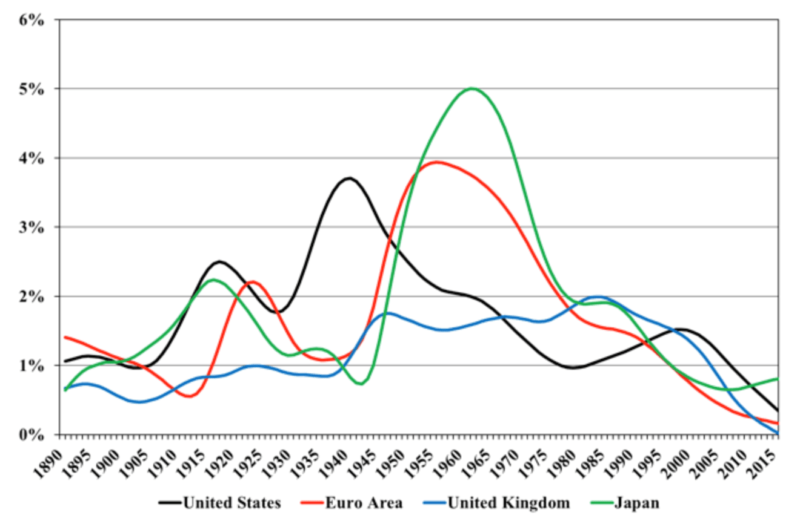
The chart below shows the comparison between the invention of portable power in the 1890’s and the IT revolution which began in the 1970’s:
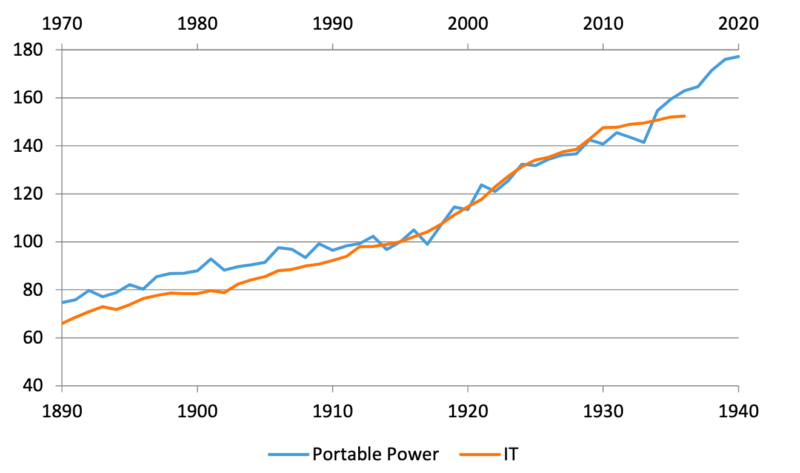
The contrary view is that technology today is much more rapidly adopted. I would point to blockchain, distributed ledger technology (DLT) as a perfect, current example of how this trend persists. DLT applications were first developed in the early 1990’s, and since 2008 the technology has gained traction but the scope of its potential applications are still several years away.
The absence of productivity gains are probably the result of a combination of several or all of the factors proposed above, but returning to the original comparison of the economic performance of the US and Denmark, overall, the US appears to have been far more productive during the last 60 years, although not on a per capita basis.
Income
What about income? The latest OECD estimate for Danish household net adjusted disposable income was $29,606, ranking it 15th out of the 40 countries they monitor. Household net wealth was estimated to be $118,637, ranking it 30th. By contrast, US household net adjusted disposable income was $45,284, and household net wealth, $632,100, ranking the US 1st and 2nd respectively.
I was unable to find average income data for Denmark prior to 1987, but at that time Danish average annual income was approximately $20,400 whilst the US average was $32,410. Comparing 1987 with 2018 it appears that the gulf between (lower) Danish and (higher) US average income is actually narrowing.
At What Cost?
What has been the social cost of the US focus on economic growth? Is the inclusiveness of the Nordic model worth the price? The OECD measure of social inequality shows a very different ranking to household income and wealth. Denmark ranks 6th out of 39 countries, whilst the US ranks 35th.
The Danish model of higher taxation and a more comprehensive, free, welfare state has both a cost and a benefit. What is seen is the narrower gulf between Denmark’s rich and poor, and what is not seen is the toll this model takes on personal freedom. This is not a criticism, but merely an observation, and the Danes appear largely satisfied.
There is neither a right nor a wrong approach to economic and social policy, but Denmark and the US are excellent examples of differing policies and divergent outcomes. The two countries’ political systems have evolved in a fundamentally different way, yet they are both outcomes of the democratic process. One should anticipate that the US, with lower taxes and lower benefits, will grow faster and therefore be able to support a greater number of people in aggregate, whilst Denmark will grow more slowly and remain more socially cohesive.
Other Nordic countries achieve better economic outcomes than Denmark. The table below makes a full comparison:
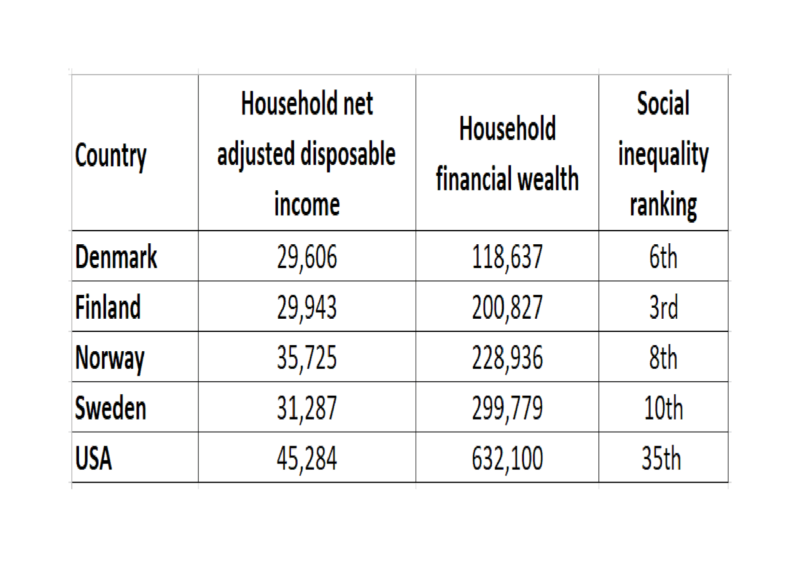
The most striking disparity in the table above relates to household net wealth; the US is in a different league. Seeking an explanation, the next two charts look at the performance of the Danish OMX20 and the US Dow30:
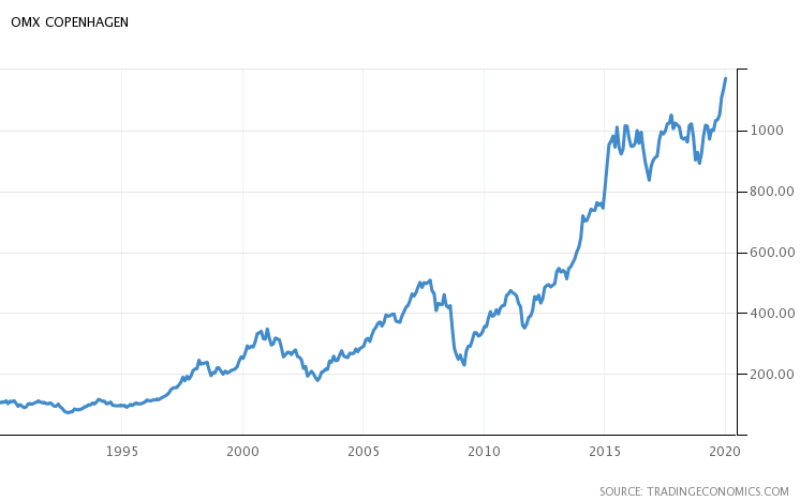
The chart above shows the performance of the Danish OMX 20 Index. Since 1990, it has risen from 107 to nearly 1,200.
Over the same period the Dow 30 Index has achieved remarkably similar results: –
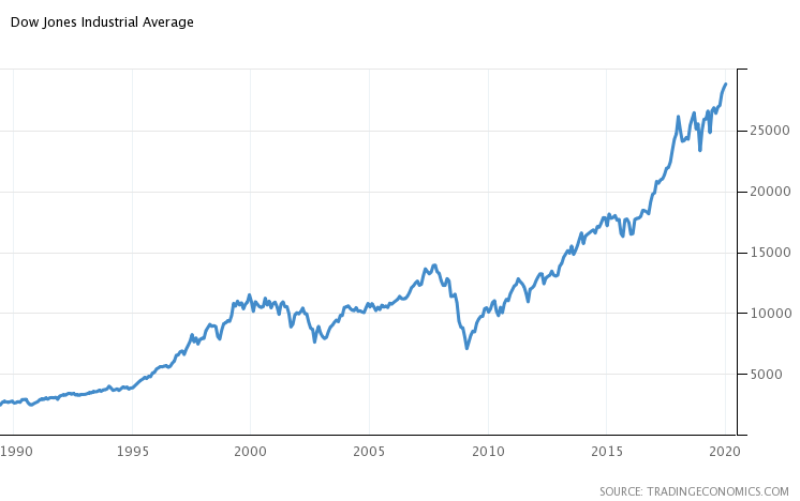
If the wealth created by the Danish stock market is not reaching the pockets of Danish households, where does this pool of wealth reside? Danmarks Nationalbank provides an answer of sorts. At the end of Q2 2019, 52% of Danish stocks were held by foreign investors. By comparison, only 35% of US stocks reside in foreign hands.
Conclusion
There are many commentators who wax lyrical about the ‘socialist’ Nordic model’s ability to promote relative income equality. The counter-argument is that free market, liberal policies had cemented the conditions for income equality long before the experiments with higher taxation. In their 2013 publication ‘The long-run history of income inequality in Denmark: Top incomes from 1870 to 2010,’ the authors, A.B. Atkinson and J.E.Søgaard, observe that incomes had already become more equal by the 1950s.
Whilst migrants are generally more productive and upwardly mobile, a current comparison of Danes and Danish-Americans is revealing. Measured by GDP per capita, Danish-American living standards are 55% higher than their counterparts in Denmark.
The key to the Nordic Model, is, I believe, cultural. A combination of what might be dubbed the ‘Protestant Work Ethic,’ together with an emphasis on individual responsibility, honesty, trust and punctuality. The great liberalization of the Nordic economies during the latter half of the 19th century and first half of the 20th century is a testament to the egalitarian effects of free markets and freedom of choice. The philosophical beliefs which underpinned Adam Smith’s ideas of the ‘Invisible Hand’ and that very human desire for, ‘not only praise, but praiseworthiness,’ are the backbone of the Nordic system, rather than the high-tax, high-welfare regime of the last sixty years.
Colin Lloyd

Colin is a macroeconomic commentator, writer and presenter, based in London, England. He has worked for asset managers in commodities, money markets, capital markets, equities and foreign exchange since the early 1980’s and writes In the Long Run. He is a contributor to several free-market publications including The Cobden Centre and was a 2017 runner-up for the 2017 Richard Koch Breakthrough Prize awarded by The Institute of Economic Affairs.