Trump’s Rallies Killed People? It’s Fake Science

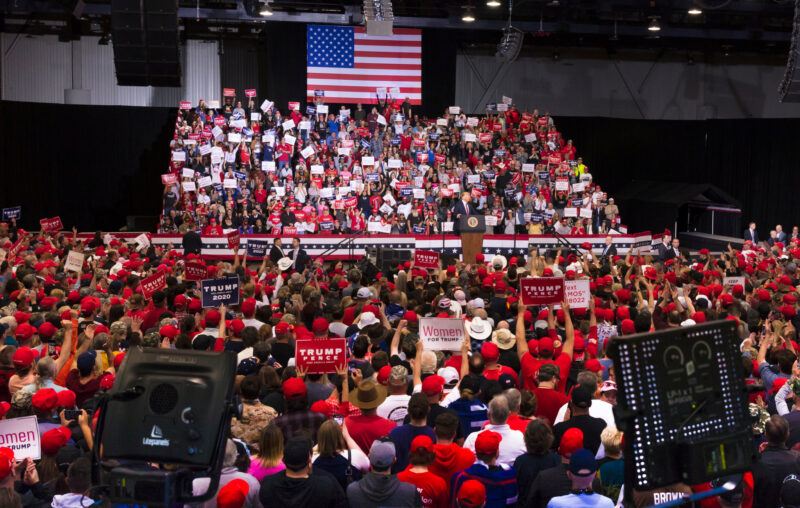
Just before a major election, and scary Halloween, Doug Bernheim et al released a working paper (“The Effects of Large Group Meetings on the Spread of COVID-19: The Case of Trump Rallies,” 30 Oct.) that purports to show that 21 Trump rallies caused a total of 30,000 cases and 700 deaths. Those cases, they assert, were incremental, meaning that they would not otherwise have occurred.
Trump rallies, says this study, were superspreader events. For all I know, they might have been. The world is a complicated place. But we also know with absolute certainty that in order for this paper to cultivate its results – along with its definitive conclusion – the authors had to do a tremendous superspreading of statistical manure.
The authors question studies that show that individual Trump rallies, like the infamous indoor one in Tulsa, did not cause numerous infections (e.g., D.M. Dave et al, “Risk Aversion, Offsetting Community Effects, and COVID-19: Evidence from an Indoor Political Rally” NBER Working Paper 27522”) because “COVID-19 outcomes are highly variable” (p. 3). In other words, some rallies may have been superspreader events while others probably weren’t.
Fair enough, but simply combining data from 21 rallies to condemn them all is a bit like saying that a baseball team had a winning record because it lost 19 games 1 to 0 but won its last one 20 to 0. Yes, it scored more runs in total than its opponents, 20-19, and also scored more runs on average than its opponents did, 1 to 0.95, but its record was still 1 win and 19 losses. In short, “measuring the average treatment effect over multiple events” does NOT produce “more reliable results;” it produces, at best, an estimate of the average result.
Bernheim et al also use data for 10 weeks (instead of 3 like in other studies) after the rally because “the effects of a superspreader event may snowball over time.” Again, that may well be true but error terms also snowball over time. In the limit, one hits the post hoc ego propter hoc (after this, therefore because of this) fallacy.
For example, as the graph below from its official state site shows, cases went up in South Dakota in September and then surged in October. Was that a snowball from Trump’s Mount Rushmore visit on 3 July? The Sturgis motorcycle rally in early August? The opening of pheasant season, which also brought in an influx of out-of-staters?
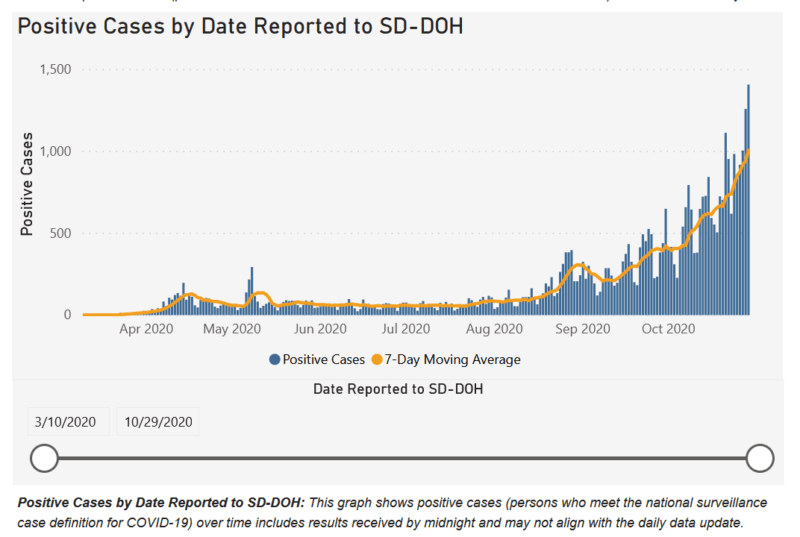
South Dakota is particularly interesting because it reminds us that Covid-19 data is a statistical artifact of the real world, where people and viruses travel across political boundaries with impunity. One person can contract a case in another country, state, or county but be counted in another. Another person can spread the virus elsewhere and remain asymptomatic and never appear in the official stats at all.
Bernheim et al have county-level data, so the county becomes a magical thing in their analysis even though we know reality is much more complex. They know where the rallies were held but not where the rally participants actually came from, or went to afterwards. Using the most convenient data, a common technique in economics, is a lot like the drunk looking for his keys under the streetlamp even though he lost them in the dark alley far away.
Imagine, for example, a Trump rally held in a true blue county just because the event space happened to be located in one and was convenient to get to. It drew in no one from that county but lots of people from a nearby red state. Cases then increased in this blue county 6, 7, 8 weeks later simply because it had not been hit previously. Bernheim et al would blame the rally for that spread.
Without actually tracing transmission from person-to-person (which if anyone actually could do the virus would have been stopped in March), how can one tease out all this noise from this world full of possible explanations for the spread of a virus that sometimes causes disease?
Well through statistics of course! And assumptions. Another assumption (they do cite a single CNN article) is that compliance with “social distancing” rules was uniformly low at the Trump rallies examined, which all took place between 20 June and 22 September. Yet the authors insist the outcomes were “highly variable,” almost as if social distancing compliance is not that important to spread. (This is one reason I called for more controlled experiments way back in April.)
If fact, despite their confident assertion that Trump rallies killed 700 people, the authors admit that “the dynamics of COVID-19 are complex” (p. 5) and vary over time and place. “Substantial cross-county heterogeneity with respect to the manner in which the dynamic process has evolved over time” means that “familiar econometric specifications with time and county fixed effects are not able to accommodate the first-order patterns in the data. Specifications that include interactions between time-fixed effects and a handful of county characteristics perform only marginally better” (p. 6).
Translation: the data did not show what the authors wanted it to and they know that a lot of people will be checking their results so they did not want to employ the usual econometric cheat codes.
Ergo, “an entirely different approach is required” (p. 6). That approach is called “matched sampling.” It basically tries to replicate an actual experiment with control and treatment groups by identifying counties “‘similar’” (p. 6) to the ones where rallies were held and comparing their Covid cases and deaths to those of rally counties. The concept of similarity of counties is so fraught that the authors themselves actually place quotation marks around it (hence the double quotation marks above).
Obviously, the comparison counties cannot be identical because Trump did not hold rallies in them and he most assuredly was not holding rallies in random counties. But maybe the comparison counties are similar enough? In what ways? What characteristics are most important to compare? The authors assume “the most important dimension of comparability is the pre-event trajectory of COVID-19 cases” (p. 7) but of course “trajectories” stemming from different causes may land in very different places. The trajectory of a baseball and a missile, for example, may be similar at first but one lands in the catcher’s mitt and the other goes into orbit.
The authors find that cases increased in rally counties compared to their matched counties. The 95 percent confidence range is huge (150 to 500 cases per 100,000) but greater than zero. The size of the effect diminishes as more controls, like “total population,” “percent less than college educated,” and “Trump vote share in 2016” (p. 10) are added, which usually happens in statistical studies with low predictive power and the addition of spurious controls (like total population where population density would make more sense).
Moreover, cases that do not lead to hospitalizations (strangely absent from the study) or death are arguably good because they increase community immunity as the eminent scientists who penned the Great Barrington Declaration point out.
The authors’ death estimates are based on simple multiplication of the known death rate to the number of incremental cases presumably caused by the rally, but they admit that “the same death rate might not apply to baseline cases and incremental cases” and that “total deaths might not rise at all” (p. 11). They could not, however, find statistical evidence of changes in average “death rates,” by which they must have meant CFR (case fatality rates). But who knows, because like many econometricians they do not show their work.
Cognizant that those statistical analyses may strike some as unconvincing, the authors then take a close look at the number of tests and their positive rates in two Wisconsin counties where Trump held rallies “because testing data are readily available for Wisconsin” (p. 13). The number of tests did not go up immediately post-rally but positivity rates did in the two rally counties, although not “in aggregate” for the rest of the state. I suspect the authors, who believe themselves to be econometric geniuses, chose to report the data for the rest of the state in aggregate because they cannot explain why positivity rates increased in some counties far from the rally sites but declined in nearby counties.
In short, contra the paper’s conclusion, the authors’ analysis suggests, rather than “strongly supports” (p. 13), that large group gatherings can spread Covid-19 under certain unknown conditions. They present no data on social distancing guideline compliance at the rallies, so their claim that large group gatherings where “the use of masks and social distancing is low” are “particularly” (p. 13) likely to encourage spread is essentially obiter dictum.
Finally, the assertion that the communities where “Trump rallies took place paid a high price in terms of disease and death” (p. 13) is normative because it imposes their own value judgments about cases, which not everyone believes are negative. Death is certainly negative but by their own admission they do not know how many of those deaths occurred because of direct attendance at a rally and strongly imply that, in fact, there was at least one, and perhaps several, intervening infections until the virus struck a vulnerable or elderly person who succumbed.
A lawyer or an insurance adjuster would immediately invoke the concept of contributory negligence here. Just because A caused B, which combined with other events to cause C, and others to cause D, doesn’t mean that A is wholly, or even necessarily partly, or even at all, responsible for D. Heck, why not blame Patient Zero for everything and leave it at that?
When it comes to Covid-19, it is not easily spread by asymptomatic people. Still, if you don’t want to catch it, you need to take precautions not to get it. Don’t blame Trump, or anyone else except the person who actually transmitted to you, if you do. Even then it might not be the transmitter’s fault in the legal or insurance sense because like the tango, it takes two to get Covid.
Discerning cause and effect in any area of life is a difficult proposition. Doing so for the transmission trajectory of a widespread virus, within a radically heterogeneous population over large land masses where millions of variables are at work, is harder still. One might even say: impossible. It surely is not enough to throw together a paper that is 95% statistical mumbo-jumbo, and with a firm conclusion that impacts on an earth-shaking election that is only three days away. Scientific integrity requires much more than coming to a politically correct result summed up with a made-for-media soundbite.
Robert E. Wright

Robert E. Wright is the (co)author or (co)editor of over two dozen major books, book series, and edited collections, including AIER’s The Best of Thomas Paine (2021) and Financial Exclusion (2019). He has also (co)authored numerous articles for important journals, including the American Economic Review, Business History Review, Independent Review, Journal of Private Enterprise, Review of Finance, and Southern Economic Review. Robert has taught business, economics, and policy courses at Augustana University, NYU’s Stern School of Business, Temple University, the University of Virginia, and elsewhere since taking his Ph.D. in History from SUNY Buffalo in 1997. Robert E. Wright was formerly a Senior Research Faculty at the American Institute for Economic Research.
Find Robert
- SSRN: https://papers.ssrn.com/sol3/cf_dev/AbsByAuth.cfm?per_id=362640
- ORCID: https://orcid.org/0000-0003-3792-3506
- Academia: https://robertwright.academia.edu/
- Google: https://scholar.google.com/citations?user=D9Qsx6QAAAAJ&hl=en&oi=sra
- Twitter, Gettr, and Parler: @robertewright