The Everything Bubble and What it Means for Your Money


In the aftermath of the Black Plague which swept across Europe between 1347 and 1353, wiping out between 30 and 60% of the population, the European economy changed dramatically.

The Black Plague had a lasting socioeconomic impact; for example, towns and cities emptied, and the sudden reduction in the labour force saw wages rise. Meanwhile attitudes towards death – and life – changed. The Latin phrase, carpe diem, quam minimum credula postero – seize the day, place no trust in tomorrow – epitomised this profound shift in attitudes.
The current pandemic, whilst utterly tragic, has been far less catastrophic, but due to the policy response it too appears destined to leave its mark in changing patterns of living and working. Unlike the 1350’s, however, where the changing price of goods and services signalled imbalances in supply and demand, the valiant monetary and fiscal actions of governments and institutions have distorted this price discovery mechanism.
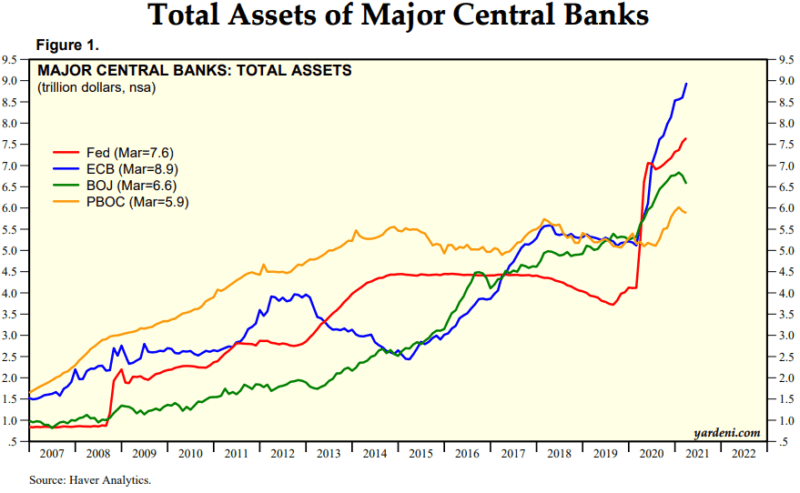
During the first months of the lockdown, economic growth declined and the price of many equities – and even bonds – fell rapidly. Central banks responded, as they had during the Great Financial Crisis (GFC) of 2008/2009, by cutting interest rates, or, where interest rates could be cut no further, by increasing their purchases of government bonds and other high grade securities. As a result of these purchases, major central banks balance sheets have swollen to $29trln: –
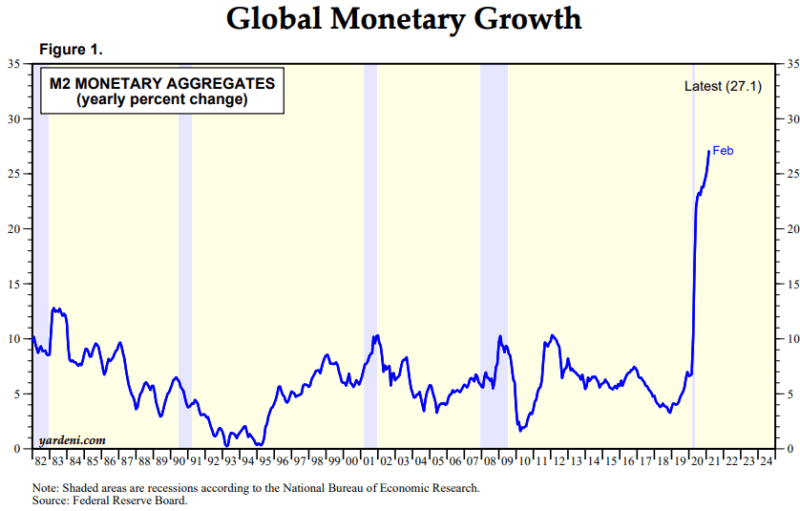
The effect of central bank actions has spilled over into a ballooning of global money supply: –
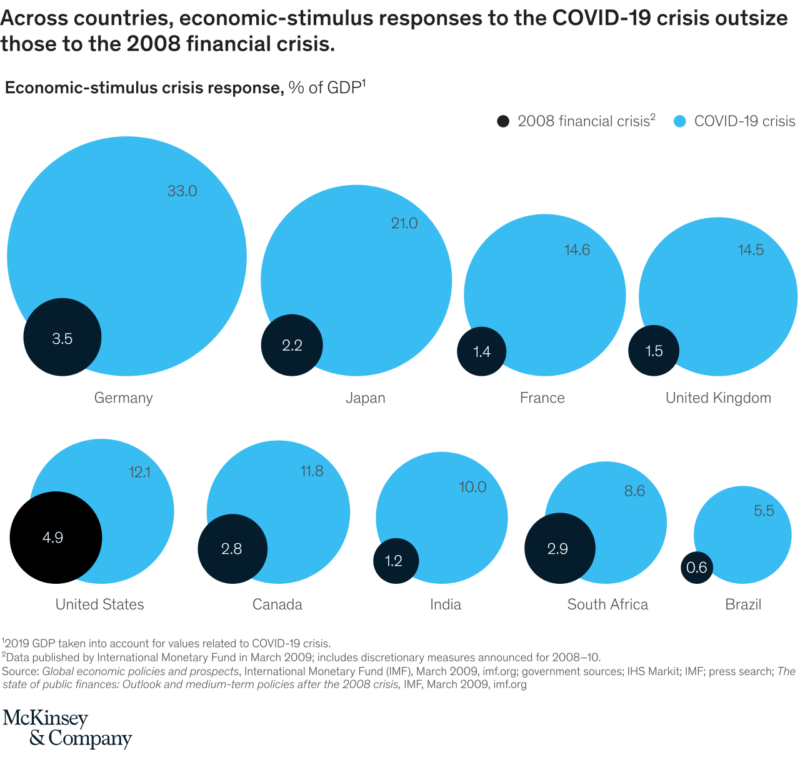
Governments, cognizant of the limitations of their central banks, also reacted, providing loan guarantees, supporting the furloughing of employees and sending direct payments to the rising ranks of the unemployed. The chart below, which is from July 2020 and therefore does not account for the recent US $1.9trln spending package, nor the $2trln infrastructure proposal, shows the scale of these endeavours in comparison to the fiscal largesse of the GFC: –
The impact of lower interest rates, buying of bonds and increased fiscal spending might be expected to have inflationary consequences but it has been leaning against the headwind of sharply rising global unemployment: –
The rise in unemployment was itself a response to a dramatic decline in economic growth: –
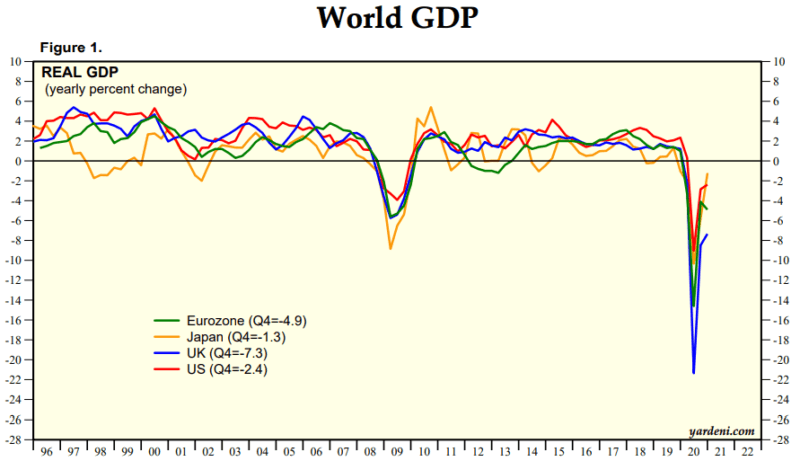
US unemployment data is beginning to improve but, as the IMF WEO April 2021 reveals, Europe may take much longer to respond. Euro area unemployment is expected to rise from 7.9% in 2020 to 8.3% in 2022. Forecasting unemployment, however, together with many other economic variables, has become much more challenging since the variance between estimates has expanded: –

Savings Surge
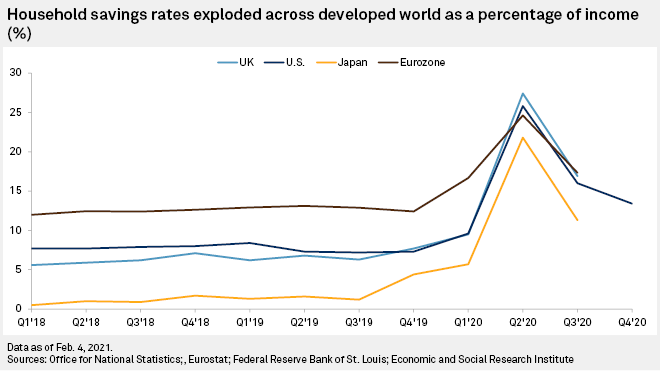
A natural side effect of rising unemployment, furloughing of staff, together with reduced mobility and economic activity, during the waves of pandemic lockdowns, has been a rise in household savings: –
The initial recipients of this spring tide of excess savings were the banks: –
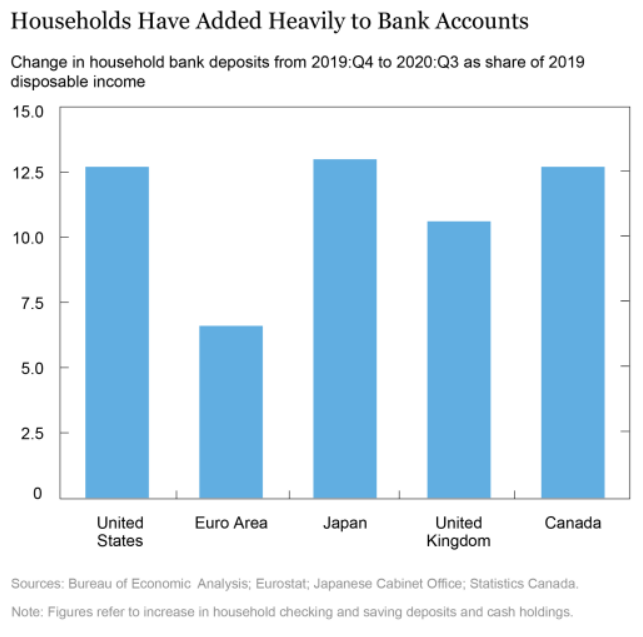
Oxford Economics estimates that US savings rose $1.6trln, Eurozone households added Euro470bln and those of the UK, £170bln. Estimates from Moody’s put the figure even higher, suggesting that the global pool of excess savings may now have reached $5.4trln – roughly 6% of global GDP. Since we are only interested in the impact of ‘excess savings’ rather than ‘all savings,’ the next chart is informative. It shows the monthly change in US savings: –
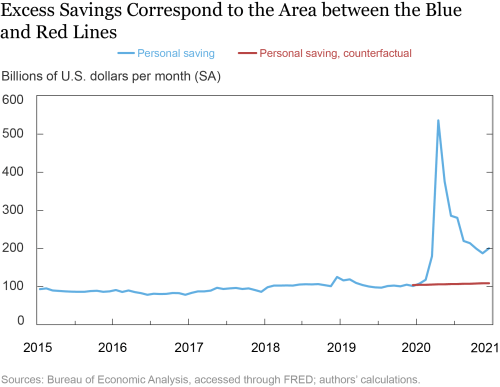
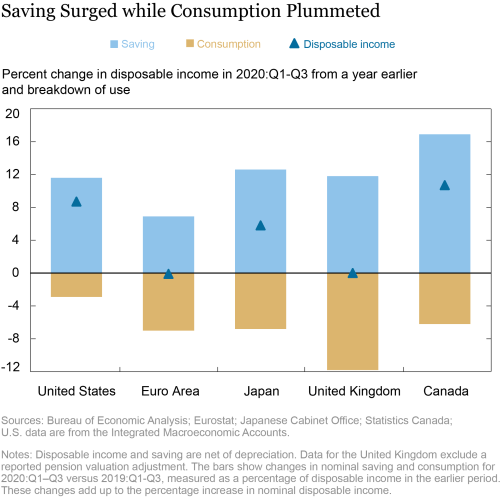
What will be done with these pools of saving? They may remain in bank accounts, be used to pay down debt, spent on goods and services or invested. In a recent article – What Is behind the Global Jump in Personal Saving during the Pandemic? The Federal Reserve reveals the impact during Q1-Q3 last year: –
Debt Binge
The next chart shows global debt and the debt to GDP ratio: –
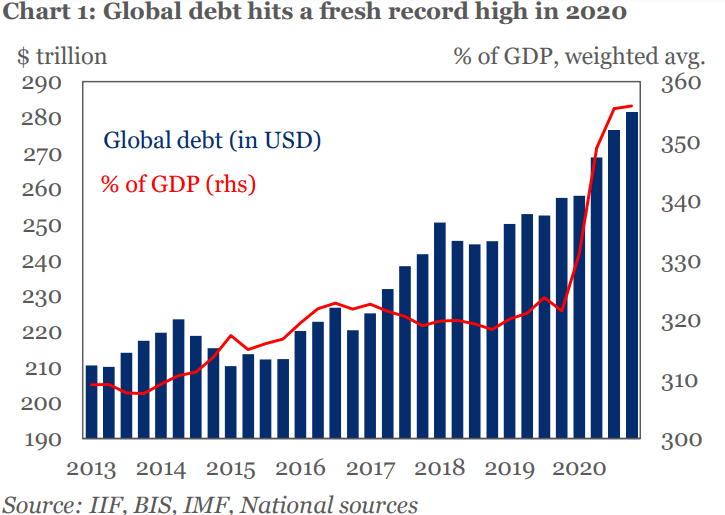
Such estimates probably underestimate financial sector debt and do not account for OTC derivatives, which, according to the Bank for International Settlements have a net value of $609trln.
Setting aside derivatives, here is a breakdown by debt type for a selection of larger countries: –
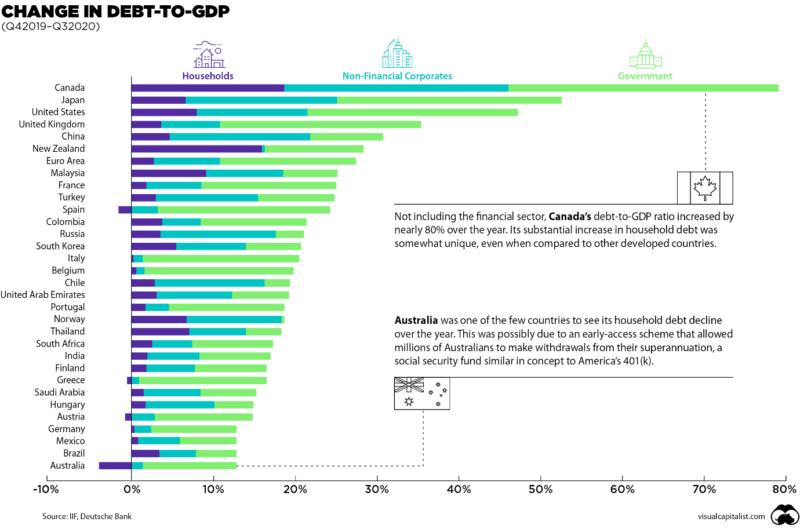
During 2020, relative to GDP, government debt rose from 89% to 105%, and financial sector debt to a more moderate 81%. Meanwhile, non-financial private sector debt swelled to 165% and non-financial corporate debt to 100%, helped by debt moratoria and loan guarantee programs. Many large firms, particularly in the U.S. and Japan, increased borrowing simply to bolster their cash holdings. Despite rising savings, household debt even managed to increase, from 61% to 65% of GDP, encouraged by cheap mortgages and the resilience of residential real estate: –
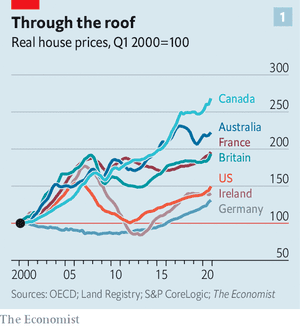
Elected government officials will be afraid to stem these price rises, as they hope that homeowners will feel wealthier which should feed through, eventually, to consumption. A belated exception is New Zealand, which extended its ‘bright-line test’ to reign in price increases which hit 23% annualised in March. This smacks of window dressing, as increasing the time an investment property must be held in order to gain tax breaks, from 5 years to 10, is hardly aggressive. Meanwhile, to avoid political censure, they have also introduced incentives for first-time buyers, desperate to get on the first rung of the property ladder. The UK government response to rising residential property prices has been more predictable, allowing the maximum loan to value to rise to 95%, creating an even more leveraged residential market.
Of course the price of housing also responds to changes in supply. This is the picture in the US, where, despite feverish building activity, the supply of existing homes remains severely constrained: –
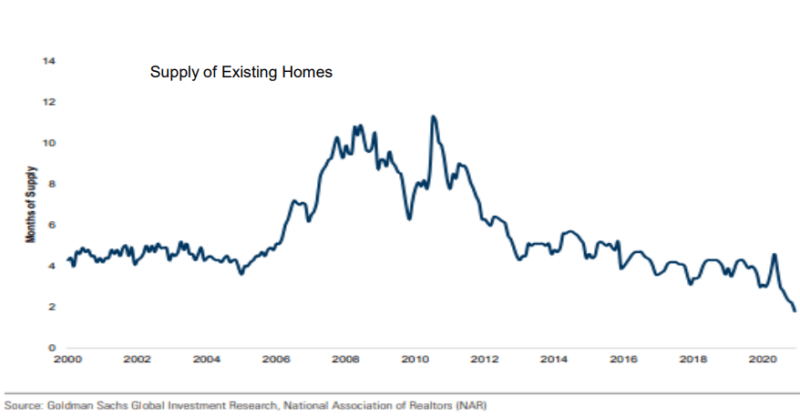
The purchasers of this dwindling supply of residential real estate look increasingly like the ‘haves’ rather than ‘have nots’ – 14% of all US mortgage applications made in February were for second homes, compared to just 7% in April 2020. Similar patterns are evident in other countries. Little wonder, then, that household debt has risen.
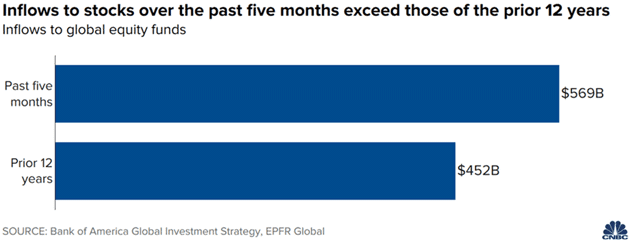
If household savings are not being used to pay down debt, that leaves three choices; continued saving (in other words lending to the banks at near zero interest), consumption or investment. The rising price of stocks and resilience of bonds suggests savings are flowing into liquid asset markets: –
Bond markets are more difficult to gauge, as they are not the retail investors’ first port of call. However, central banks continue to expand their balance sheets and the majority of the assets they purchase remain government and agency bonds. Meanwhile, many institutions are required to maintain liquidity in their portfolios, making them reluctant buyers of fixed income securities despite negligible or negative real yields.
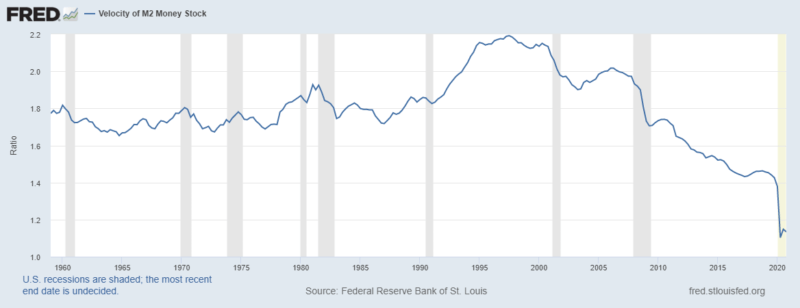
Other assets have also increased in price, including an array of commodities and cryptocurrencies. Some of this price appreciation is due to supply constraints but in many instances demand is driving prices higher. This may be because investors fear that the combination of fiscal and monetary expansion, combined with supply chain constraints and trade tensions, will awaken the slumbering giant inflation. This picture must be tempered, for as money supply has expanded dramatically, its velocity has continued to decline. The chart below shows US M2 but similar patterns are evident in other developed markets: –
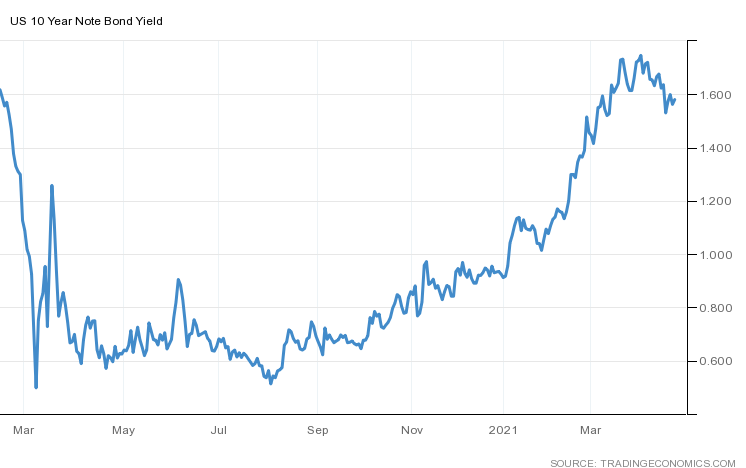
The US Treasury Bond market, led by the eponymous bond vigilantes, took flight in February and March: –
The bond market regained composure thanks to the palliative tone of the Federal Reserve, elegantly expressed in a recent speech by Governor Lael Brainard – Remaining Patient as the Outlook Brightens (emphasis mine): –
…The emphasis on outcomes rather than the outlook corresponds to the shift in our monetary policy approach that suggests policy should be patient rather than preemptive at this stage in the recovery.
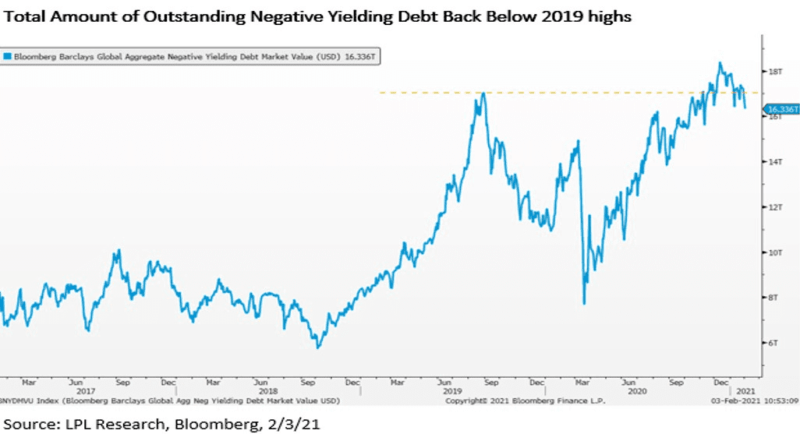
Many developed market government bonds remain close to the zero bound, yet yields have risen from their nadir at the end of 2020. As of 2nd March a mere 17% of sovereign issuance enticed investors with a negative yield to maturity: –
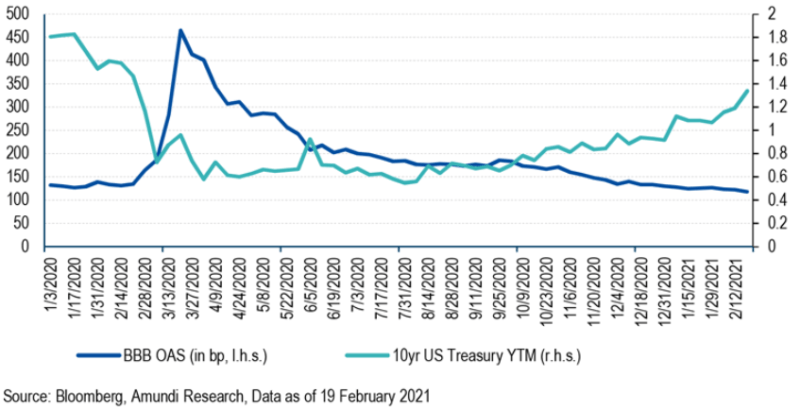
The quest for yield, which has driven investors into riskier assets for more than a decade, continues to provide an alternative to low or negative-yielding government paper. The dark blue line on the chart below shows the narrowing of the credit spread of BBB corporate bonds even as US 10-year yields rose: –
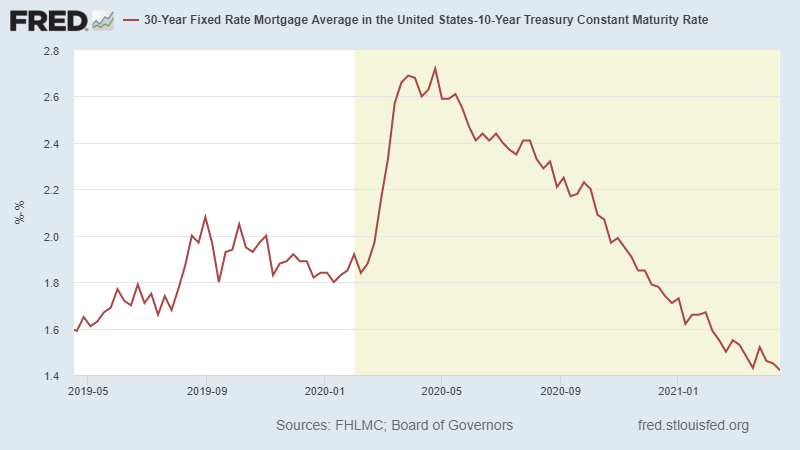
This yield compression is seen even more starkly in the spread between US 10-year and 30-year US mortgages: –
Household Wealth
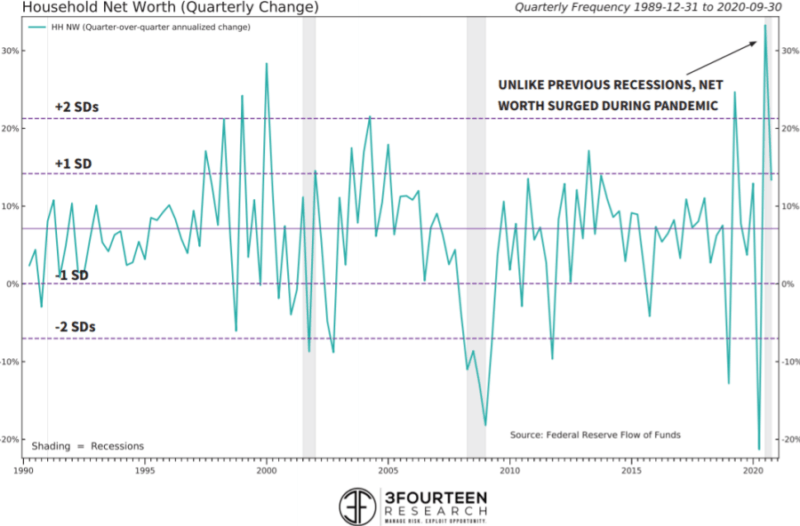
Considering the constrained nature of the US residential housing market and the fact that the 30-year Mortgage to 10-year Treasury spread is at its narrowest since July 2011 one can hardly be surprised at the appreciation of residential real estate prices. In fact the inflation of The Everything Bubble means that, unlike previous recent recessions, during the recent pandemic household net worth has actually risen: –
The Great Reopening
Looking back over the last year, it is unsurprising that asset markets have risen. As lockdowns end and life returns towards the new normal, the key question is, what percentage of excess savings and recent investments will be redirected towards consumption and how quickly?
The Conference Board Global Consumer Confidence Index hit an all-time high of 108 in Q1, 2021, up from 98 the previous quarter – this is the highest reading since the survey began in 2005. Confidence rose in 49 out of 65 markets. When the UK reopened retail outlets, after four months, on April 12th, year-on-year footfall surged +516%, but it was still down -15.9% on the equivalent day in 2019. According to a Mintel Survey, 34% of UK consumers still feel unsafe visiting stores. Full lockdown restrictions in the UK will not end until June 21st. The road to reopening will be gradual.
The US Morning Consult Consumer Confidence Index reveals a similar picture: –
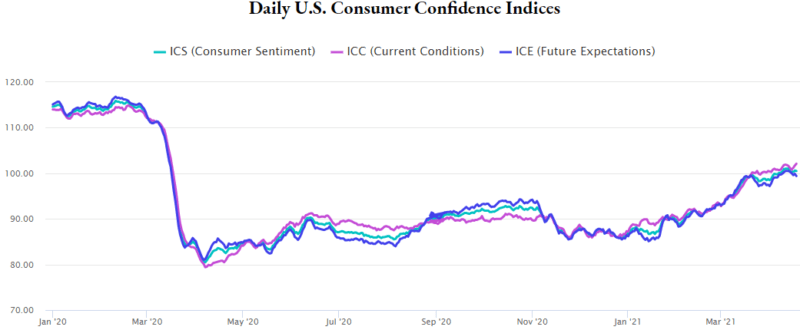
Morning Consult indices of 15 other economies show the same pattern, yet in each case a larger share of lower income households reported a deterioration in their financial position over the past year.
Goldman Sachs estimates that nearly two-thirds of excess savings in the US are held by the richest 40%, and they predict that the majority of these savings will be saved rather than spent. As of Q3, 2020 the top 20% of households by wealth held $10.2trln in liquid assets, the next 20% owned $2.3trln, whilst the balances of the remaining 60% amounted to just $2.7trln. As of end Q4, 2020 the top 20% garnered an additional $1.5trln of savings, and the remaining 80% accumulated just $0.7trln.
This breakdown between richer and poorer households is important. A recent Federal Reserve study revealed that, under normal circumstances, households in the bottom quintile spend $0.97 of every dollar earned, while those in the top quintile spend just $0.48. A February Bank of America survey, asking more than 3,000 people how they would use another stimulus check, reveals a similar result – only 36% said they would spend the money.
If only $570bln out of $5.4trln of excess savings has been invested in stocks so far this year, there would appear to be a powerful put option under the stock market, but is this the correct conclusion? Without consumption spending, corporate profits will disappoint. Without consumption, demand-pull inflation will melt away, leaving only supply-chain bottlenecks to prop up inflation forecasts. Unemployment is still elevated, union membership continues to decline and new private capital expenditure will arrive cautiously. The bond vigilantes may have come to their inflationary senses, for government bond yields have already started to decline.
Lower bond yields, however, will support the stock market, as they have done for the last decade, and so too will excess savings. Add in cheap finance and The Everything Bubble looks set to continue. The melt-up from here will be gradual and there is room for some sharp corrections as the base effect of last year’s disinflation spooks the inflation bears.
As for what is really happening? The Everything Bubble is a grand illusion, money is growing more plentiful, credit more available. Asset prices are not really rising; it is the value of money which is being systematically undermined. “I wonder whether the motto for this pandemic will be carpe diem, quam minimum credula pecuniae – seize the day, place no trust in money?”
Colin Lloyd

Colin is a macroeconomic commentator, writer and presenter, based in London, England. He has worked for asset managers in commodities, money markets, capital markets, equities and foreign exchange since the early 1980’s and writes In the Long Run. He is a contributor to several free-market publications including The Cobden Centre and was a 2017 runner-up for the 2017 Richard Koch Breakthrough Prize awarded by The Institute of Economic Affairs.