The Economy, Summed Up in One Chart
We are coming up on the seventh anniversary of the end of the Great Recession, and for about that long, Americans have been looking for a better-defined storyline for the U.S. economy.
There have been moments of great expectations, and like the recent lackluster jobs report, moments of fear. But a look at the chart above shows that the story of the economy has been remarkably consistent, if unexciting.
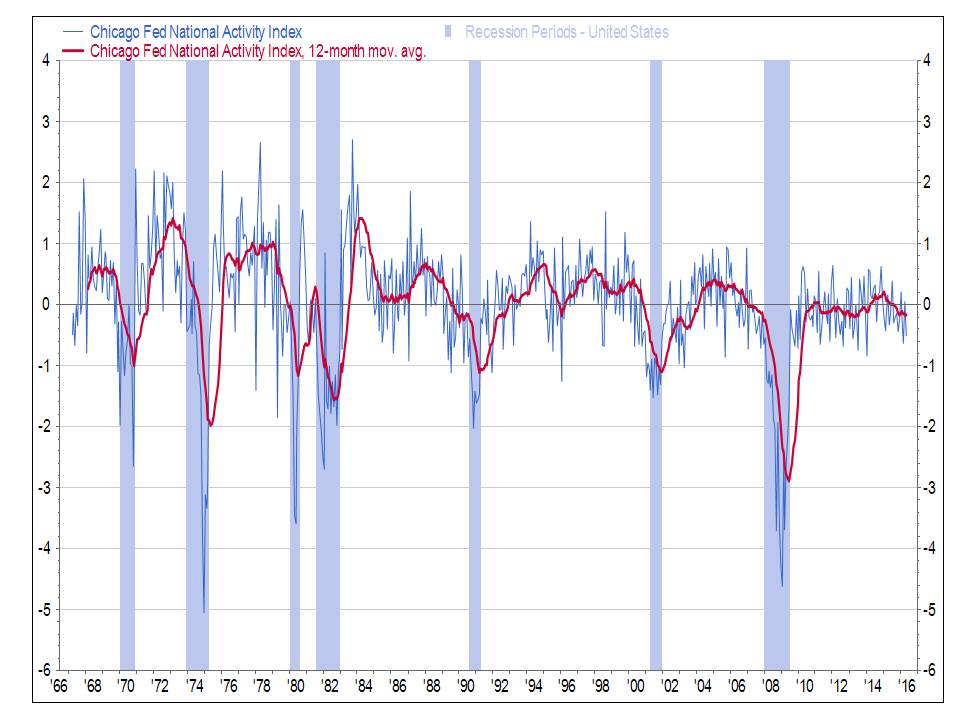
This morning, we received the latest reading from the Chicago Fed National Activity Index, a composite of 85 economic data series, which shows the U.S. economy growing slightly below trend (zero on the chart is trend growth in the economy). The red line on the chart above shows the 12-month moving average since the mid-1960s. Pay attention to the period after the recession, starting in 2009.
The index shows that U.S. economic growth has hovered around or slightly below the long-term trend growth line for the entire period since the recession, notes Bob Hughes, senior research fellow at AIER. There haven’t been any wild swings in either direction.
“It really does tell you what we’ve been experiencing, this slow, slightly below trend growth,” Hughes said. “We’re not in recession, and it doesn’t predict whether we’re going into recession. But it sums up what people are feeling, this ongoing slow-growth economy.”
“It’s been mediocre, slow growth, but growth,” Hughes said.
Click here to sign up for the Daily Economy weekly digest!