The Columbia-NYT Model Can’t Be Right

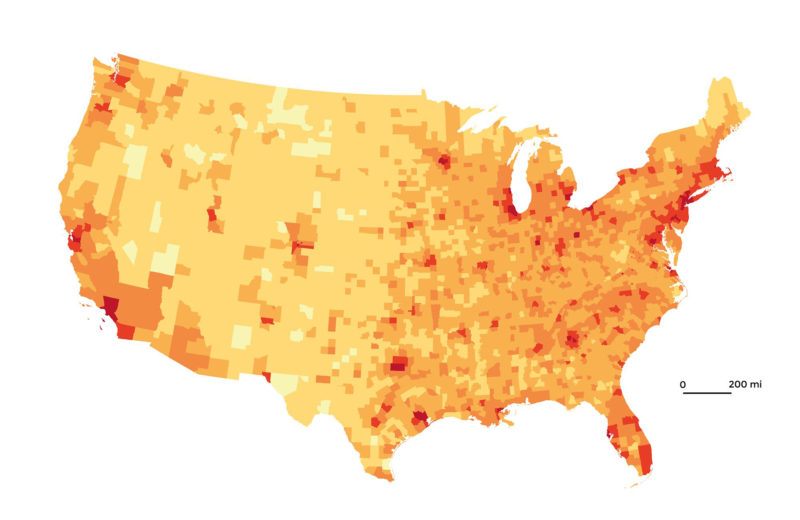
The New York Times has headlined an article and several interactive maps, based on research conducted by researchers at Columbia University, purporting to show the spread of COVID-19 infections over the next few months across the continental United States by county under three scenarios: no control measures, some control measures, and severe control measures.
It’s riveting, engaging, alarming.
Also, it cannot be correct.
Under the “no transmission reduction” scenario the infection rate for almost every county in the entire United States is predicted to exceed 65 percent and in many places is predicted to exceed 90 percent. Such high rates would be unprecedented in epidemiological history, underdeveloped as that field is, and exceed the CDC’s own worst-case scenario.
True, the virus is “novel” but infection rates naturally cannot exceed about 65 percent. To see why, consider that the number of new infections on a given day is determined by those infected on the previous day times their average number of contacts with uninfected persons (1 – proportion infected) times the probability of transmission per contact.
Controls like social distancing, hand washing, shuttering businesses and such are meant to reduce the average number of contacts and the probability of transmission per contact.
But note that the number of uninfected persons declines as the number of infected increases, naturally slowing the spread of the infection. Think of it as the law of diminishing returns applied to biology. The proper models are logistic, not exponential. In other words, when plotted they look like S curves, not moonshots. If this doesn’t make sense to you, check out this video.
Also, many of the county-level predictions look dubious. I will concentrate my critique on South Dakota, where I have lived since 2009. While I have not set foot in every county in the state, hunting, fishing, traveling, and research (for Little Business on the Prairie) has given me a good feel for most of it.
I cannot fathom a 60 percent-ish infection rate for Miner and Sanborn counties by 1 May with no controls or by 10 June with some controls. The 30ish percent predicted by 1 August with severe controls also seems outlandish, even though most of the denizens of those counties are ranchers and farmers of a politically conservative bent not likely to allow Washington, or even Pierre (South Dakota’s capital), to impose severe controls on them.
Most South Dakotans simply live too far apart. Sure, they congregate in churches and local bars and restaurants, like Animal in Canova (Miner Co.), but not often or in large numbers, especially during planting and calving season. Normally, they travel to Sioux Falls or Rapid City about once a month to stock up but they likely have already stocked up on essentials like everyone else. Those who didn’t prepare have neighbors or relatives who will help them out and there is plenty of fat and protein around for everybody: cattle, sheep, hogs, chickens, fish, and, in a pinch even if they are out of season, deer and pheasants. Plenty of switchgrass and corn cobs for the bathroom duties too.
Most can make their own alcohol if need be. I don’t know if they can make their own smoke too and both interest rates and the stock market are (somehow) down, but Hank Williams, Jr. pretty much has the situation pegged in his song “Country Boy Can Survive.”
Rural South Dakotans are friendly enough, if you aren’t trespassing on their land, but most don’t want to shake your hand even in normal times and anyway are probably wearing a glove covered with snow, placenta, or entrails, depending on the season.
I am only partly in jest but the notion that 69 percent of the residents of rural McCook County will be infected while only 40 percent of the residents of Minnehaha, home of the much more densely populated Sioux Falls, will be infected seems far-fetched at best. I believe that the death rates will be higher in rural counties due to their gerontological age structure but that too suggests that infection rates will be lower.
West River (that means west of the Missouri for the coastal elites reading this) remains John Birch Society country. The Columbia-Times model reveals a similarly bizarre pattern there, with Rapid City, the state’s second biggest city, predicted to have a lower rate of infection than rural Lyman, and not much higher rates than almost unpopulated counties in the Black Hills. The biggest restaurant in Deerfield Reservoir (Pennington County) seats about 20 tops and will be lucky to have more than 5 patrons at one time this year, no matter what official controls are in place. In case your parents never took you on a 40-hour car trip to Mount Rushmore, this is what a lot of the West River part of the state looks like. Those are dinosaur (fossil) hunting grounds, not avant-garde buildings, and hardly breeding grounds for a pandemic.
Another oddity is that the state’s Indian Reservations are predicted to come through the pandemic relatively unscathed. Unfortunately, the researchers coded their stuff in an arcane programming language so it is difficult to observe exactly what they did but apparently the lack of roads on Reservations is predicted to save them. There is something to that but the lack of cars also means that hitchhiking is still commonly practiced although it is just as illegal and frowned upon on Reservations as elsewhere. (See Ian Frazier’s On the Rez.) Plus there are some cultural beliefs and practices that might increase infection rates along with, you know, the grinding poverty and inept Indian Health Services.
Of course no model can include everything; like the communal living style of South Dakota’s Hutterites, members of each colony of which are likely to all get infected, but only if any of them do. But the Columbia-Times model seems a lot like the simple money multiplier model in macroeconomics principles textbooks, i.e., one divided by the reserve requirement. It misses a lot of natural brakes to disease spread (deposit expansion) and hence overestimates, by a lot.
It also seems disingenuous to claim such precision based on 14 confirmed cases of COVID-19 in the state to date, out of 663 negative tests of those considered at-risk. I could use that data and a simple model to concoct three Alfred E. Neuman-style “What Me Worry” scenarios. But I won’t because the independent AIER has more integrity than the New York Times, a commercial enterprise more dependent on attracting eyeballs than serving the public interest.
This is just one state. A similar critique could be made of every spot on the map. Most of the disease-forecasting models hitting the headlines these days are based on applying dubious exponentials on vast numbers of unknowns, while the public-relations spin weaves the appearance of certainty that is unsustainable given existing knowns.
Robert E. Wright

Robert E. Wright is the (co)author or (co)editor of over two dozen major books, book series, and edited collections, including AIER’s The Best of Thomas Paine (2021) and Financial Exclusion (2019). He has also (co)authored numerous articles for important journals, including the American Economic Review, Business History Review, Independent Review, Journal of Private Enterprise, Review of Finance, and Southern Economic Review. Robert has taught business, economics, and policy courses at Augustana University, NYU’s Stern School of Business, Temple University, the University of Virginia, and elsewhere since taking his Ph.D. in History from SUNY Buffalo in 1997. Robert E. Wright was formerly a Senior Research Faculty at the American Institute for Economic Research.
Find Robert
- SSRN: https://papers.ssrn.com/sol3/cf_dev/AbsByAuth.cfm?per_id=362640
- ORCID: https://orcid.org/0000-0003-3792-3506
- Academia: https://robertwright.academia.edu/
- Google: https://scholar.google.com/citations?user=D9Qsx6QAAAAJ&hl=en&oi=sra
- Twitter, Gettr, and Parler: @robertewright