The Chicago Fed National Activity Index Suggests Above-Trend Growth

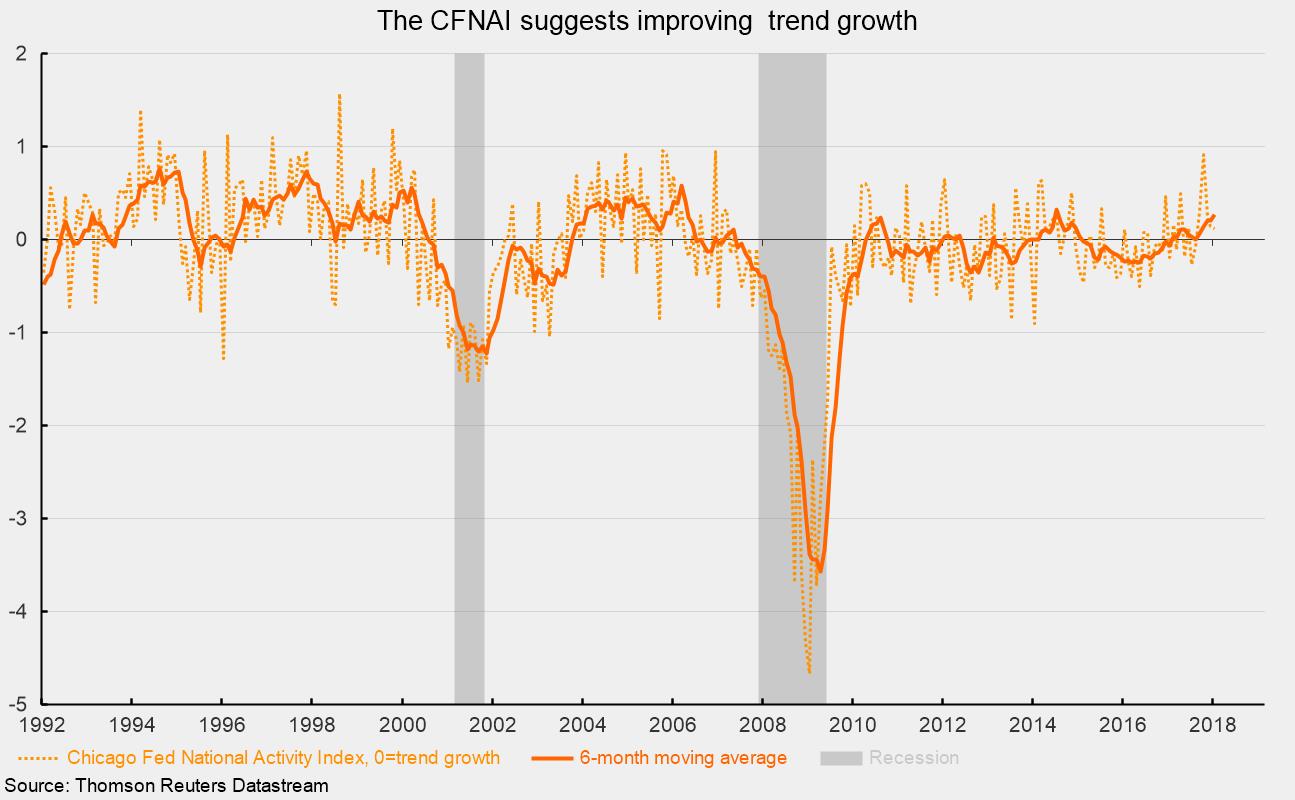
The Chicago Fed’s National Activity Index pulled back in January, coming in at 0.12, down from 0.14 in December. The index is a composite of 85 economic data series. It is constructed so zero represents trend growth in the economy, with readings above zero suggesting above-trend growth and readings below zero indicating below-trend growth.
The index posted its third monthly decline after surging to 0.91 in October, the highest reading since December 2006. The six-month average, which helps reduce month-to-month volatility in the index, came in at 0.272, the highest since July 2014.
The overall index comprises four component indexes: production and income; employment, unemployment, and hours; personal consumption and housing; and sales, orders, and inventories. For January, two of the four component groups posted negative contributions as personal consumption and housing made a −0.03 contribution versus a −0.05 contribution in December while production and income made a −0.01 contribution compared to a +0.11 contribution in December.
Offsetting the negative contributions were a +0.09 contribution from employment-related indicators and a +0.07 contribution from the sales, orders, and inventories segment.
Despite the weaker performance in January, the index remains above zero, suggesting economic growth remains above its long-term trend. The six-month moving average has been moving higher since mid-2016 and is broadly consistent with the AIER Leading Indicators Index, which hit a low of 38 in March and April of 2016 and has improved significantly since. The performance is also broadly consistent with the stronger performance of real gross domestic product growth over the past few quarters. However, compared to prior expansions, the six-month average for the Fed’s index remains well below prior expansion peaks. During the 2001–7 expansion, the six-month average index hit a peak of .582 in March 2006, while during the 1991–2001 expansion, the index peaked at .763 in August 1994. Furthermore, in both prior expansions, the index spent more time above zero, and during some periods, well above zero.
The performance of the Fed’s index over the past several months reflects the fact that the labor market remains robust, incomes are rising, and confidence is relatively high, and suggests the outlook remains upbeat, with the likelihood of recession over the next several months quite low. The favorable outlook, however, does not reduce the need to remain vigilant for signs of unsustainable growth, particularly in money and debt, and to avoid assumptions about future economic conditions that are overly optimistic and might result in underestimating risks.
Robert Hughes

Robert Hughes joined AIER in 2013 following more than 25 years in economic and financial markets research on Wall Street. Bob was formerly the head of Global Equity Strategy for Brown Brothers Harriman, where he developed equity investment strategy combining top-down macro analysis with bottom-up fundamentals. Prior to BBH, Bob was a Senior Equity Strategist for State Street Global Markets, Senior Economic Strategist with Prudential Equity Group and Senior Economist and Financial Markets Analyst for Citicorp Investment Services. Bob has a MA in economics from Fordham University and a BS in business from Lehigh University.