The Chicago Fed National Activity Index Posts Another Weak Month

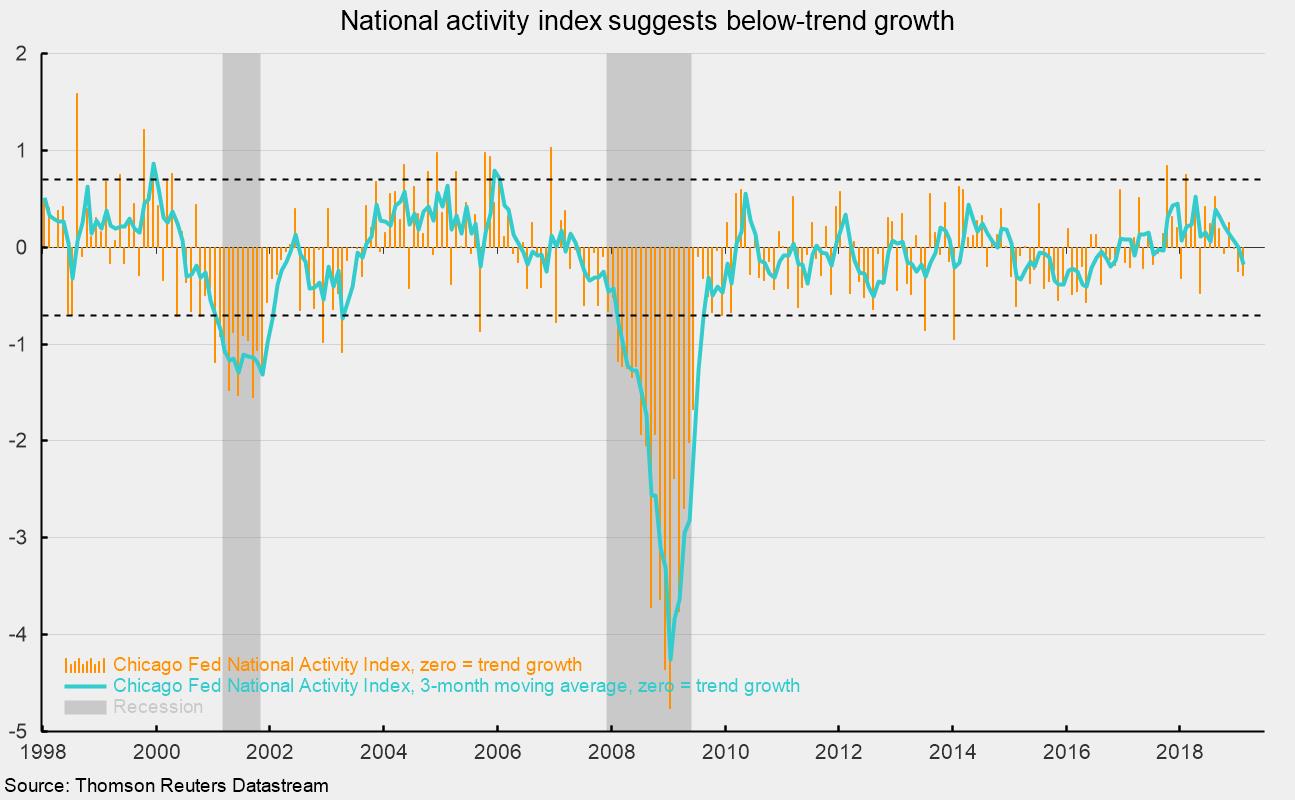
The Chicago Fed’s National Activity Index pulled back in February, coming in at −0.29, down from −0.25 in January. The index is a composite of 85 economic data series. It is constructed so zero represents trend growth in the economy, with readings above zero suggesting above-trend growth and readings below zero indicating below-trend growth.
The index posted its third monthly negative result in a row and the fourth in the last five months. The three-month average, which helps reduce month-to-month volatility in the index, came in at −0.18 versus a neutral reading in January.
The overall index comprises four component indexes: production and income; employment, unemployment, and hours; personal consumption and housing; and sales, orders, and inventories. For February, three of the four component groups posted negative contributions as production and income made a −0.16 contribution compared to a −0.29 contribution in January, employment-related indicators made a −0.10 contribution in the latest month, down from a +0.07 result last month, and personal consumption and housing made a −0.06 contribution versus a −0.03 contribution in January. Partially offsetting the negative contributions was a +0.03 contribution from the sales, orders, and inventories segment, up from a +0.01 contribution in January.
For the February estimate, 45 of the 85 indicators were available. Estimates were used for the unavailable data. The diffusion index for February was −0.05 versus +0.12 in January. The CFNAI Diffusion Index represents the three-month moving average of the sum of the absolute values of the weights for the underlying indicators whose contribution to the CFNAI is positive in a given month less the sum of the absolute values of the weights for those indicators whose contribution is negative or neutral in a given month.
Despite the weaker performance in February, the index remains above levels historically associated with either recession or significant price increases. Readings below −0.70 for the three-month moving average of the national activity index have been associated with recessions while readings above +0.70 have been associated with an increasing likelihood of persistent price increases. Similarly, readings below −0.35 for the diffusion index have been associated with recessions.
The data support a cautiously positive outlook with results suggesting weak growth but not recession, and little risk of significant price increases.
Robert Hughes

Robert Hughes joined AIER in 2013 following more than 25 years in economic and financial markets research on Wall Street. Bob was formerly the head of Global Equity Strategy for Brown Brothers Harriman, where he developed equity investment strategy combining top-down macro analysis with bottom-up fundamentals. Prior to BBH, Bob was a Senior Equity Strategist for State Street Global Markets, Senior Economic Strategist with Prudential Equity Group and Senior Economist and Financial Markets Analyst for Citicorp Investment Services. Bob has a MA in economics from Fordham University and a BS in business from Lehigh University.


