Services and Manufacturing Sectors on Diverging Paths

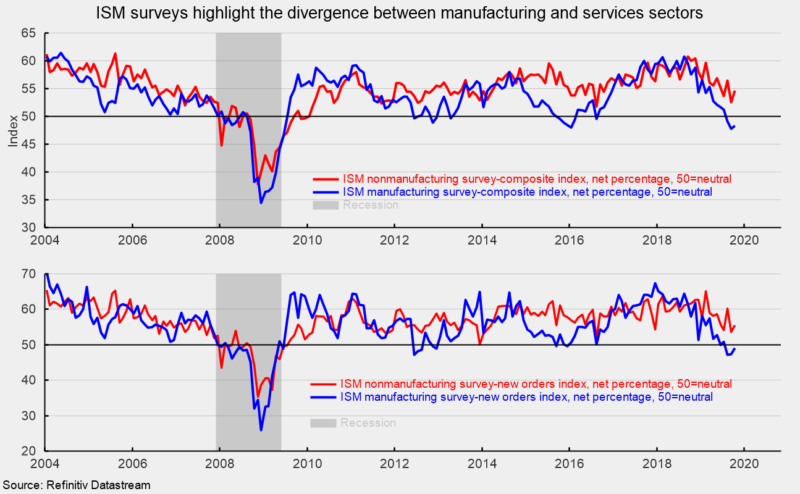
The Institute for Supply Management’s nonmanufacturing composite index rose to a reading of 54.7 from 52.6 in September (see top chart). For this index, 50 is neutral, with readings above 50 suggesting expansion for the sector and readings below 50 suggesting contraction. Historically, readings above 48.6 have suggested expansion of the overall economy. The October result is the 117th consecutive month above 50 suggesting expansion for the services sector and the 123rd month above 48.6 suggesting expansion for the overall economy. This stands in significant contrast to the ISM Manufacturing Purchasing Managers’ Index, which remained below 50 for the third consecutive month in October (see top chart again).
Among the key components of the nonmanufacturing index, the business-activity index (comparable to the production index in the ISM manufacturing report) was 57.0 in October, up from 55.2 in September. For October, 13 industries in the nonmanufacturing survey reported growth while three reported contraction.
The nonmanufacturing new-orders index came in at 55.6, up from 53.7 in September (see bottom chart). October was the 123rd month with readings above 50. The positive reading suggests diverging paths for services versus manufacturing, where the new-orders index remained below neutral for the third month in October.
The new-export-orders index, a separate index that measures only orders for export, was 50.0 in October following 32 months of expansion. The neutral result is consistent with slowing global economic activity and deteriorating trade relations.
The nonmanufacturing employment index increased to 53.7 in October from 50.4 in September. The improved reading is consistent with services-sector employment gains reported in the October jobs report from the Bureau of Labor Statistics.
Supplier deliveries, a measure of delivery times for suppliers to non-manufacturers, came in at 52.5, up from 51.0 in September. It suggests suppliers are falling further behind in delivering supplies to non-manufacturers and the slippage has accelerated a bit from the prior month.
The one component that had been raising concerns in the nonmanufacturing report is the prices index. It had been bouncing around in the 60–65 range from September 2017 through November 2018, but it has been at or below 60 for 11 consecutive months, posting a reading of 56.6 in October. This result suggests non-manufacturers are experiencing materials-costs increases but that the pressure may be a bit less than last year. Some of the price pressure is likely due to escalating tariffs.
Today’s report from the Institute of Supply Management suggests that growth reaccelerated in the nonmanufacturing sector in October. The results stand in sharp contrast to the weak results of the ISM manufacturing survey released last week. The services sector of the economy continues to be the main source of growth while manufacturing industries struggle with erratic trade policies and weak global growth.
The latest Job Openings and Labor Turnover Survey from the Bureau of Labor Statistics shows the number of open positions in the private sector fell to 6.300 million in September. Total job openings dropped to 7.024 million. Private-sector openings are down in six of the past ten months since the peak in November 2018, a drop of 602,000 or 7.9 percent. The job-openings rate, openings divided by the sum of jobs and openings, was 4.7 percent for the private sector, down from 4.8 percent last month and a peak of 5.2 percent in November. Though the level of openings remains high by historical comparison, the downward trend in job openings suggests employers may be getting more cautious about future business prospects.
The industries with the largest number of openings were professional and business services (1.27 million), health care (1.07 million), leisure and hospitality (964,000), and retail (714,000). The highest openings rates were in professional and business services (5.5 percent), leisure and hospitality (5.5 percent), information (5.4 percent), and transportation, warehousing, and utilities (5.5 percent).
While private-sector openings declined, private-sector separations, layoffs and quits, rose. Separations rose to 5.454 million from 5.385 with layoffs rising to 1.860 million and quits falling to 3.310 million from 3.419 million. The layoffs rate rose to 1.4 percent from 1.3 percent while the quits rate fell to 2.6 percent from 2.7 percent.
Overall, the data relating to the labor market are still relatively strong by historical comparison, but many measures have shown a noticeable deterioration in recent months. The weakness may be a sign that erratic and incoherent policy is undermining confidence in the economic outlook. Still, attracting and retaining qualified labor is likely to remain a critical issue for business in the immediate future.


