Retail Sales and Industrial Production Rise in May; Consumer Sentiment Falls in Early June

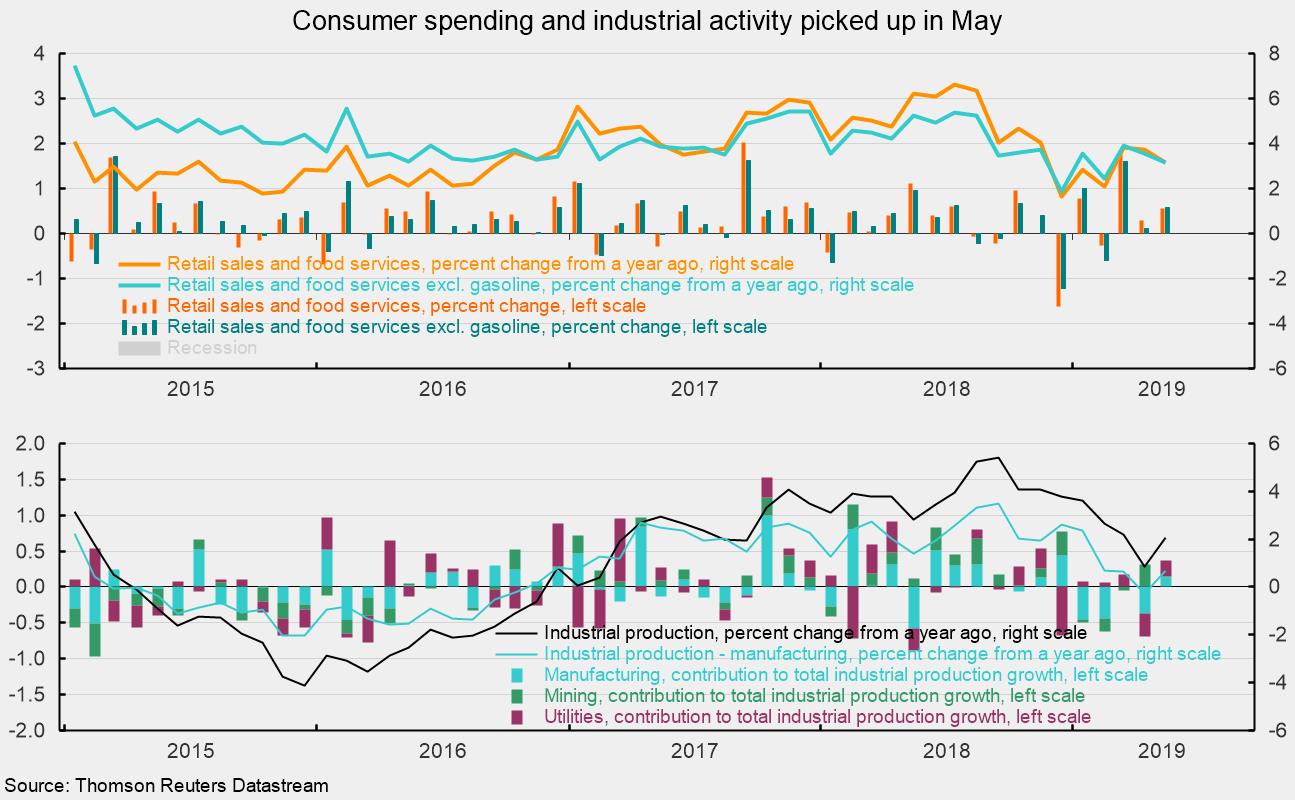
Retail sales and food services rose 0.5 percent in May, following an upwardly revised 0.3 percent gain in April. The May increase was the third rise in a row and fourth in the last five months. Over the past year, they are up 3.2 percent (see chart). Retail sales excluding gasoline rose 0.6 percent in May following a 0.1 percent gain in April. From a year ago, retail sales excluding gas are also up 3.2 percent (see chart).
Gains in retail sales in May were widespread among the components. The only major components to show a decline for the month were food and beverage stores, for which sales fell 0.1 percent for the month but which still show a 1.6 percent increase over the past year, and miscellaneous store retailers, whose sales dropped by 1.3 percent and are down 2.6 percent from a year ago.
Non-store retailers increased 1.4 percent for the month, the best for the monthly gainers, and also led all categories with an 11.4 percent rise over the past year. For the first five months of 2019, non-store retailers are up 10.7 percent versus the same period in 2018 and account for about 11.7 percent of all retail sales and 20 percent of retail sales excluding motor vehicles, gasoline, and restaurants.
Gasoline stations and motor vehicle and parts dealers both posted gains in May, rising 0.3 percent and 0.7 percent, respectively. However, gasoline sales tend to be driven by price changes (as opposed to sales volume) more than other categories; therefore, large increases or decreases are less meaningful for gauging real economic activity. Average retail prices for gas increased 2.4 percent for the month. The rise in motor vehicle spending was supported by higher unit-sale volume. Unit-auto sales rose in May, hitting a 17.3 million-unit annualized rate versus a 16.3 million rate in April.
Other strong performers in May include electronics and appliance stores and sporting goods, hobby, musical instruments, and book stores, gaining 1.1 percent for the month, restaurants, up 0.7 percent, and health and personal-care stores, up 0.6 percent.
Industrial production increased 0.4 percent in May, following a 0.4 percent drop in April. Over the past year, industrial production is up 2.0 percent (see chart). The gain helped push capacity utilization up by 0.2 percentage points to 78.1 percent as capacity posted a 0.2 percent gain for the month.
The gain in industrial production was driven by the manufacturing sector, which accounts for about 75 percent of total industrial production. Manufacturing output rose 0.2 percent for the latest month. Within manufacturing, durable-goods production rose 0.3 percent while nondurable-goods production edged up by 0.1 percent. Leading the durable-goods production were motor vehicles and parts, wood products, and machinery. Motor vehicle production posted a 2.4 percent increase while wood-products production rose 1.3 percent and machinery production gained 1.1 percent. Primary metals production was the weakest category, falling 1.9 percent for the month. From a year ago, durable-goods production is up 2.3 percent, with most categories showing a gain.
Among nondurable-goods producers, plastics and rubber posted the strongest gain, rising 1.6 percent, while apparel- and leather-products production fell 1.4 percent. Chemicals products and food products, the two largest segments, had offsetting results, with chemicals rising 0.5 percent and food production falling 0.5 percent.
Measured by market segment, consumer-goods production (about 28 percent of total production) rose 0.5 percent in May, with consumer durables 2.0 percent and consumer nondurables up 0.1 percent. Business equipment (about 10 percent of production) rose 0.2 percent in May and is up 3.0 percent from a year ago. Within business equipment, the monthly gain was boosted by a 1.4 percent gain in industrial equipment. Every category within business-equipment production shows a 12-month gain between 2.4 and 5.2 percent — very solid performance. Construction supplies increased 0.2 percent for the month and is up 0.3 percent over the past year.
Material production (about 46 percent of output) increased 0.3 percent for the month and is up 3.5 percent from a year ago. The energy component has been a major source of volatility in this category, particularly following the collapse of energy prices in mid-2014. The non-energy component rose 0.1 percent for the month and is up 0.7 percent from a year ago.
The preliminary June results from the University of Michigan Surveys of Consumer Sentiment show overall consumer sentiment fell slightly from the final May result. Consumer sentiment decreased to 97.9 in early June, down from 100.0 in May, a 2.1 percent decline. From a year ago, the index is off 0.3 percent. Despite the slight decline, sentiment is holding at very favorable levels.
The two sub-indexes had opposing performances in early June. First, the current-economic-conditions index rose to 112.5 from 110.0 in May. That is a 2.3 percent gain for the first part of the month but a 3.4 percent decrease from June 2018.
The second sub-index — that of consumer expectations, one of the AIER leading indicators — fell 5.2 percent for the month but still showed a 2.7 percent gain from the prior year. According to the report:
In early June, consumer sentiment reversed the May gain due to tariffs as well as slowing gains in employment. Some of the decline was due to expected tariffs on Mexican imports, which may be reversed in late June, but most of the concern was with the 25% tariffs on nearly half of all Chinese imports.
Furthermore, respondents’ concerns over tariffs appear to be impacting spending plans. The survey notes:
The sole component of the Sentiment Index that improved in early June was buying plans for large household durables. That improvement, however, was due to consumers favoring tariff induced buy-in-advance price rationales. In the past year, spontaneously unfavorable references to tariffs moved in tandem with unaided mentions of buy-in-advance rationales for household durables. Negative mentions of tariffs were spontaneously made by 40% of all consumers in early June, up from 21% in May and the prior high of 35% in July 2018; unaided references to buy-in-advance price rationales were mentioned in early June by 19%, up from 12% in May, and just below the 21% in March 2018 (when Trump first announced tariffs on home appliances). Overall, the data indicate that real personal consumption expenditures will advance by 2.5% in the year ahead.
Consumer sentiment remains at broadly favorable levels, supported by a robust labor market, income gains, and record-high net worth. However, rising tariffs and erratic trade policy are starting to impact attitudes. The crucial point is whether consumers will accelerate spending in the face of tariffs, actual and threatened, but then pull back on future spending once tariffs boost prices.
Overall, today’s data are positive, showing a pickup in retail spending and industrial production in May. The Michigan survey reinforces the notion that trade wars are impacting consumer attitudes and represent a threat to the economic expansion.
Robert Hughes

Robert Hughes joined AIER in 2013 following more than 25 years in economic and financial markets research on Wall Street. Bob was formerly the head of Global Equity Strategy for Brown Brothers Harriman, where he developed equity investment strategy combining top-down macro analysis with bottom-up fundamentals. Prior to BBH, Bob was a Senior Equity Strategist for State Street Global Markets, Senior Economic Strategist with Prudential Equity Group and Senior Economist and Financial Markets Analyst for Citicorp Investment Services. Bob has a MA in economics from Fordham University and a BS in business from Lehigh University.


