November Business Conditions Monthly

AIER’s Leading Indicators index held steady in October, remaining slightly above neutral. Slow growth continues as economy remains vulnerable.
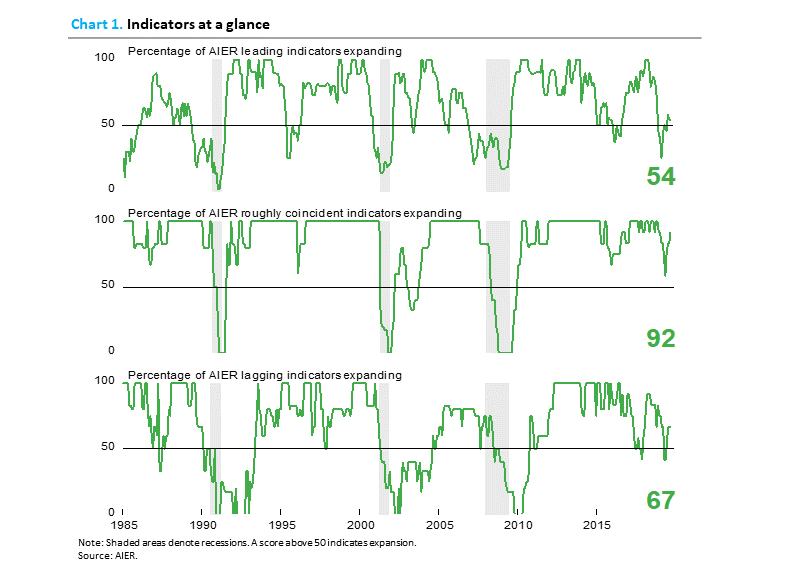
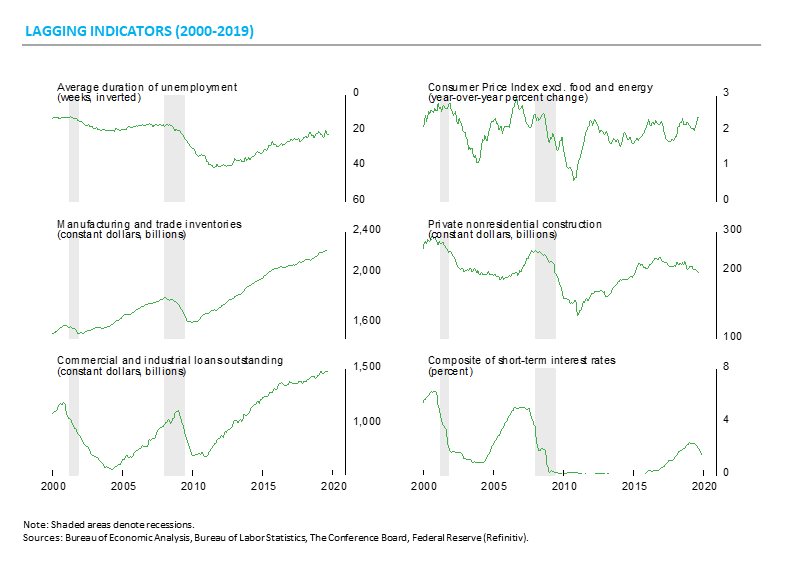
AIER’s Business Cycle Conditions Leading Indicators index was unchanged in October, staying slightly above neutral at 54. The Roughly Coincident Indicators index rose to 92 while the Lagging Indicators index remained unchanged at 67 for the third consecutive month (see chart).
Third quarter real gross domestic product rose at a modest 1.9 percent rate, slightly below the 2.0 percent pace of the second quarter. Over the last four quarters, real gross domestic product is up 2.0 percent, the slowest pace since 2016. Consumer spending accounted for the entire gain in real gross domestic product in the third quarter as other sectors had small offsetting contributions.
A strong labor market remains the primary support for consumer spending and consumer confidence. Uncertainty about trade policy, monetary policy, immigration policy and fiscal policy has the potential to undermine consumer and business confidence. Furthermore, extreme partisanship in Washington is likely to worsen as impeachment proceedings ramp up and the 2020 election cycle gains momentum. Overall, the economy continues to expand but at a slow pace, and remains vulnerable to continued erratic policies and extreme partisanship.
Leading indicators index remains slightly above neutral in October
The AIER Leading Indicators index suggests continued economic expansion, but caution is warranted.
The AIER Leading Indicators index was unchanged at 54 in October. The index has been range bound between 25 and 75 for 11 consecutive months, posting an average over the period of 47. Fluctuating around the neutral 50 level is consistent with the overall mixed performance of many economic reports. The general message is continued economic expansion albeit at a slow pace and with a heightened degree of uncertainty.
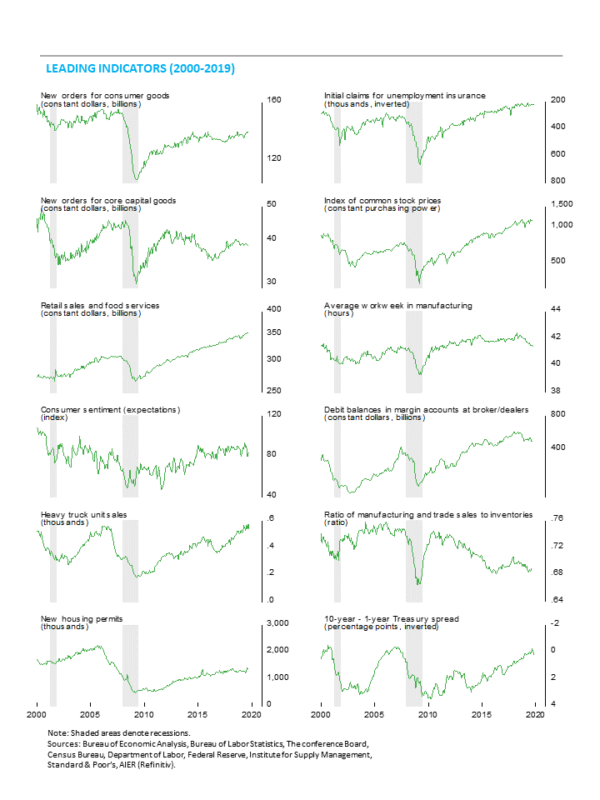
The tally of the leading indicators was the same as the prior month. Six of the 12 leading indicators had positive trends in October, with 5 trending lower and 1 indicator was neutral. However, three indicators changed direction with offsetting impact on the final index. Positive trends were seen in real retail sales and food services, real new orders for consumer goods, total heavy-truck unit sales, real stock prices, the 10-year–1-year Treasury yield spread, and housing permits. Among those, the positive trend in total heavy-truck unit sales was an improvement over the prior month when that indicator was in a down trend.
A neutral result came from initial claims for unemployment insurance. This indicator was in a favorable trend in the prior month. Initial claims for unemployment insurance is a bound indicator, meaning it can not go below zero and in practical terms is about as low as can be expected. Therefore, it’s not surprising to see the indicator move to a flat trend. It’s not as worrying to see this indicator move to neutral compared to an unbound indicator such as sales or orders. If the initial claims indicator turns to an unfavorable trend, it will be more concerning.
Debit balances in customers’ margin accounts moved to a downtrend in October, joining real new orders for core capital goods, the ratio of manufacturing and trade sales to inventory, the University of Michigan index of consumer expectations, and the average workweek in manufacturing.
Overall, the Leading Indicators index remains slightly above 50, indicating continued expansion is likely. However, the fluctuation around the neutral level over the past 11 months combined with the other mixed economic data and erratic policy suggest a high degree of caution is warranted.
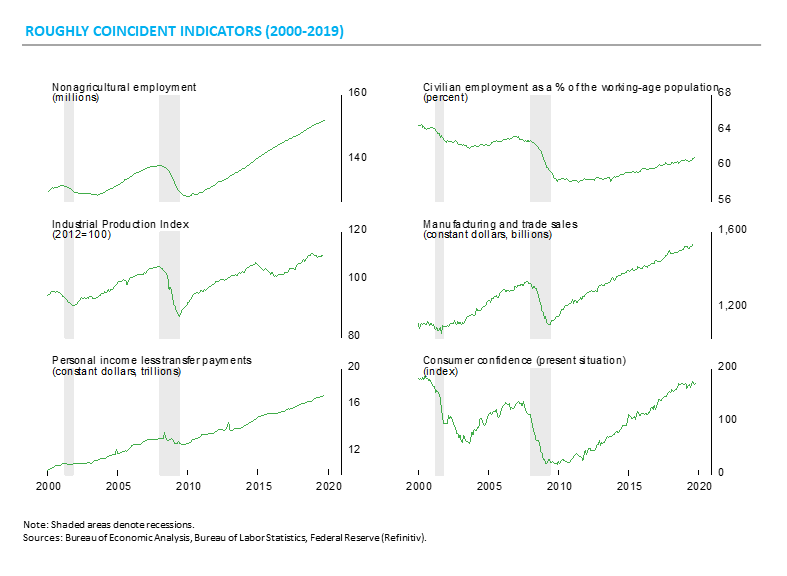
The roughly coincident indicators index rose to 92 in October from 83 in September. The industrial production indicator improved from a negative trend to a neutral trend in the latest month. The improvement may be short-lived as other data suggest a very difficult environment for the manufacturing sector. Overall, there were five indicators trending higher and one, industrial production, now neutral.
AIER’s Lagging Indicators index was also unchanged in the latest month, holding at 67 for the third consecutive month in October. The index has been above neutral for four months following a pair of 42 readings in May and June. Among the six lagging indicators, four indicators are trending higher, two are trending lower, and none are neutral.
The economy slowed in the third quarter
Real consumer spending was the only major contributor to third quarter growth.
Real gross domestic product rose at a 1.9 percent annualized rate in the third quarter, down from a 2.0 percent pace in the second quarter. Growth was driven primarily by a moderate gain in consumer spending. Housing investment and government spending made small positive contributions while business investment, net trade, and inventory change made small negative contributions in the calculation of gross domestic product.
Consumer spending decelerated in the third quarter, rising at a moderate 2.9 percent pace compared to a 4.6 percent growth rate in the second quarter. The deceleration was broad-based across the major segments of consumer spending, with durable-goods spending rising 5.5 percent versus 8.6 percent in the second quarter, nondurable-goods spending up 4.4 percent versus 6.5 percent, and services gaining 1.7 percent versus 2.8 percent. Consumer spending contributed all 1.9 percentage points of the 1.9 percent real GDP growth rate versus 3.0 percentage points in the second quarter.
Investment in business structures and equipment fell
Business fixed investment fell at a 3.0 percent annualized rate in the third quarter versus a 1.0 percent pace of decline in the second quarter. At annualized rates, the drop was led by a 15.3 percent fall in spending on structures while spending on equipment declined 3.8 percent. Investment in intellectual property products rose 6.6 percent continuing a run of 11 consecutive quarters of growth. Real business investment deducted 0.40 percentage points from overall real GDP growth versus a 0.14 percentage-point deduction in the second quarter.
Housing posts a gain
Residential investment, or housing, rose at a 5.1 percent pace in the third quarter compared to a 3.0 percent decline in the prior quarter. The gain breaks a string of six consecutive declines for residential investment. Housing had benefited from a drop in mortgage rates over recent months. However, future activity continues to face a challenging environment with interest rates starting to rise again and home prices continuing to rise, albeit at a slowing pace.
Altogether, business and residential investment declined at a 1.3 percent pace in the third quarter, subtracting 0.22 percentage points from total GDP growth compared to a 0.25 percentage-point deduction in the second quarter.
Inventories and trade had little impact in calculation of GDP
The pace of inventory accumulation by businesses was little changed in the third quarter, slowing to a $69.0 billion pace in real terms, from $69.4 billion in the second quarter. The decelerating in inventory accumulation reduced real GDP growth by .05 percentage points in the third-quarter after subtracting 0.91 percentage points in the prior quarter.
Net trade also had a small negative impact in the calculation of overall GDP growth in the third quarter, subtracting 0.08 percentage points. Exports rose at a 0.7 percent pace while imports grew at a 1.2 percent rate. The outlook for trade remains highly uncertain given erratic trade policy and slowing global growth.
Government Spending rose
Government spending rose at a 2.0 percent annualized rate in the third quarter compared to a 4.8 percent increase in the second quarter, contributing 0.35 percentage points to growth versus a 0.82 percentage-point contribution in the prior quarter. Government spending rose in nearly every category, with federal defense spending up 2.2 percent, federal nondefense spending up 5.2 percent, and state and local spending up 1.1 percent. Exploding federal deficits remain one of the most significant risks to the medium- and long-term outlook for the economy.
The labor market has softened
Job creation has slowed, and openings have fallen recently.
Job creation was better than expected in October and disappointing gains in September and August were revised higher. Furthermore, October employment was held down by the strike at General Motors. Overall, job gains over the past few months appear significantly stronger than initially estimated. However, the pace of gain is still slower than the strong gains in 2018.
U.S. nonfarm payrolls added 128,000 jobs in October, after an increase of 180,000 new jobs in September and 219,000 in August. Government census workers helped boost August and September payrolls.
For the private sector, nonfarm payrolls added 131,000 in October following a gain of 167,000 in September and 163,000 in August. October private payrolls were also held down by 46,000 striking workers at GM. With those workers included plus the upward revisions to prior months, the three-month average gain for private payrolls was 169,000, a solid result but well below the 215,000 average for 2018.
Goods-producing industries lost 26,000 jobs in October. Construction led on the upside with the addition of 10,000 new employees, while durable-goods industries lost 41,000, though 46,000 were striking workers who will return to payrolls in November.
Within private service-producing industries, which typically account for the lion’s share of job creation, payrolls rose by 157,000 workers, led by a 61,000 gain in leisure and hospitality industries. Health care and social assistance added 34,200, while professional and business services posted a gain of 22,000 jobs. Financial services added 16,000 and retail employment rose by 6,100. Information industries eliminated 4,000 positions.
Public sector employment fell by 3,000 in October after adding 130,000, or an average of 32,500 per month, over the prior four months.
Average hourly earnings rose 0.2 percent in October, pushing the 12-month change to 3.0 percent, down from a cycle peak of 3.4 percent in February. Combining payrolls with hourly earnings and hours worked, the index of aggregate weekly payrolls rose 0.3 percent in October and is up 4.3 percent from a year ago. This index is a good proxy for take-home pay and has posted relatively steady year-over-year gains in the 3 to 5 percent range since 2010 but has now been decelerating after hitting a 5.7 percent pace in January. Continued gains in the aggregate-payrolls index are a positive sign for consumer income and spending, and are likely to support continued economic expansion.
Federal government deficit worsened in latest fiscal year
Worsening deficits are unprecedented at this stage of an economic expansion. Rising debt may be a disaster waiting to happen.
The federal government continues to run massive deficits. For fiscal year 2019, the deficit totaled $984 billion, $205 billion more than in the prior fiscal year, a 26 percent jump. As a percentage of gross domestic product, the federal deficit for fiscal year 2019 totaled 3.8 percent, the third consecutive year of worsening and the worst deficit since 2013. The deficit as a percentage of gross domestic has never worsened for three straight years this late in an economic expansion.
Total public debt outstanding as October 31, 2019 was $23 trillion, the highest ever. The latest projections by the Congressional Budget Office show deficits are expected to continue to run between 4.5 and 5.0 percent of gross domestic product every year over the next 10 years, adding significantly to total debt outstanding and increasing interest expense.
Health care spending continues to rise
Total spending on health care is estimated to be $3.6 trillion in 2018, a 4.4 percent increase over 2017. Projections from the Center for Medicare and Medicaid Services show spending is expected to average 5.5 percent through 2027, pushing the share of gross domestic product from 17.9 percent in 2017 to 19.4 percent in 2027.

Robert Hughes

Robert Hughes joined AIER in 2013 following more than 25 years in economic and financial markets research on Wall Street. Bob was formerly the head of Global Equity Strategy for Brown Brothers Harriman, where he developed equity investment strategy combining top-down macro analysis with bottom-up fundamentals. Prior to BBH, Bob was a Senior Equity Strategist for State Street Global Markets, Senior Economic Strategist with Prudential Equity Group and Senior Economist and Financial Markets Analyst for Citicorp Investment Services. Bob has a MA in economics from Fordham University and a BS in business from Lehigh University.


