Municipality Second Waves: Zero and Counting


With the reopening of the US economy, some media outlets talk of a “second wave” (for example, here). But a fine piece in the Washington Examiner by Tim Carney enlightens us on talk of a “second wave.” Carney’s piece comports with what I wrote in an AIER article titled, “A Second Wave at Your Doorstep?”
In talking of a second wave, the unit of analysis should be COVID deaths (or, if we must, hospitalizations), not test-positive cases. When more tests are done, more cases are found. Neither testing nor the representativeness of test subjects is steady through time. Moreover, the antibody testing does not capture T-cell immunity. Tony Heller has a nice video criticizing the portrayal of a rising case count as a problem.
“Second wave” is a metaphor. Metaphors are used to orient thinking about a complex matter in terms of something simpler and more familiar. But metaphors can be misleading.
What’s more, metaphors may evoke multiple intuitive understandings.
The “second wave” metaphor plays upon two intuitions. The first is being at the beach and experiencing a wave and then a second wave.
The second intuition is based on looking at a chart of COVID deaths. Just as the surface of the ocean shows multiple peaks, corresponding to waves, the chart might show multiple peaks. A second peak is a second wave.
The chart-based “wave” understanding is defined by framings. One is the smoothing. If you do enough smoothing—for example, 90-day smoothing—your plot based on the data might eliminate secondary peaks. If you do zero smoothing, your plot will show a lot of little pointy peaks. For charting COVID data, something like 7-day or 14-day smoothing is reasonable.
But the more crucial framing is the geographic frame of the analysis.
Carney provides a helpful chart of hospitalizations:
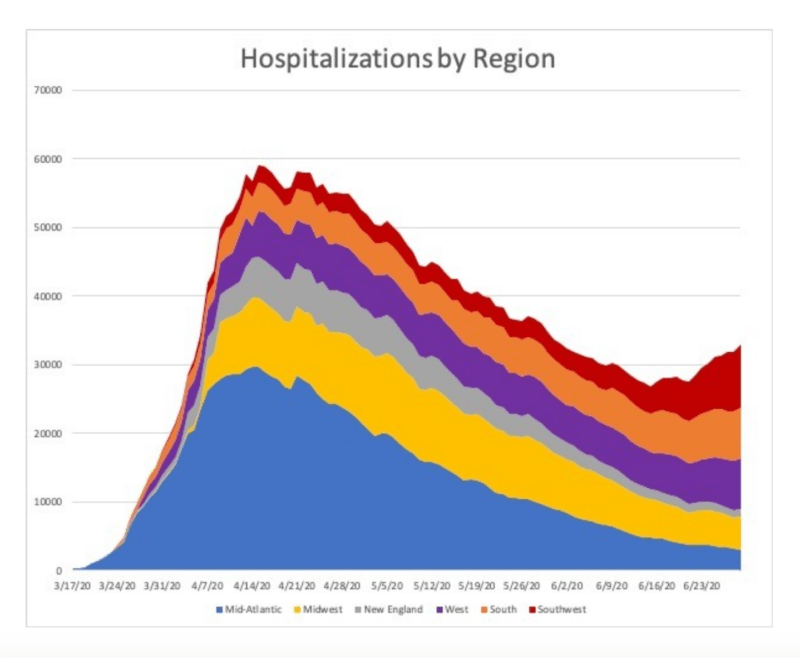
This chart shows that if we set the geographic frame at the continental United States, then hospitalizations show the onset of a second peak, or second wave.
But notice how the colors of the graph partition the country into six regions (Florida is absent from lack of data). If you set the geographic frame to any one of the regions, there is no second peak. Each region basically has a single peak. And each region is itself a huge geographic area. What we are seeing is the first, and so far only, wave “now crashing in delayed fashion further down the shoreline.”
Go back to standing on the beach and experiencing waves as they come at you. That would be like waves of COVID coming to your doorstep. That is a strong intuition for a “second wave.”
Now consider a geographic partition of mutually exclusive parts, keeping things close to one’s doorstep: Let’s think about municipalities and similar local districts.
Not a single US municipality has experienced a COVID second wave.
For that matter, I do not know of a single municipality worldwide that has experienced a second wave. Municipality second waves seem to be zero and counting.
As for Carney’s figure showing a US second wave of hospitalizations, bear in mind that hospitalizations vary in time and place, based on differences in, for example, testing for COVID, capacity ebb and flow, preparedness, patient protection and confidence, and effectiveness of treatment and therapy. For that reason, hospitalizations, as a unit of analysis, are not as important as deaths. I would rank the importance of the units of analysis as follows:
Deaths >> hospitalizations >>>>> cases
Know that when the unit of analysis is deaths, the United States does not show a second wave:
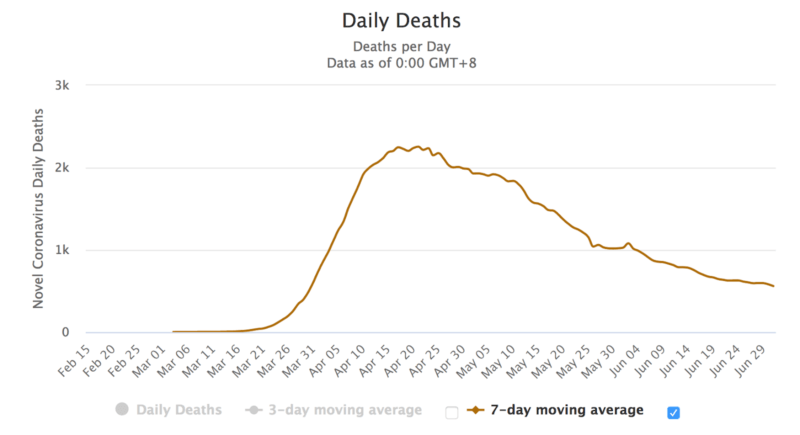
In the important sense, we have not yet seen a second wave in the United States.
It’s possible that a US second wave, based on deaths, is in our future. But it has not happened yet.
As the media continues to talk of a “second wave,” keep asking the important question: Have we yet seen a municipality second wave based on deaths?
If the answer is no, then figure that what is happening is the first wave still washing through the larger landscape.
Daniel B. Klein
Daniel Klein is professor of economics and JIN Chair at the Mercatus Center at George Mason University, where he leads a program in Adam Smith, and author of Smithian Morals.
He is also associate fellow at the Ratio Institute (Stockholm), research fellow at the Independent Institute, and chief editor of Econ Journal Watch.