ISM Surveys Suggest Diverging Paths
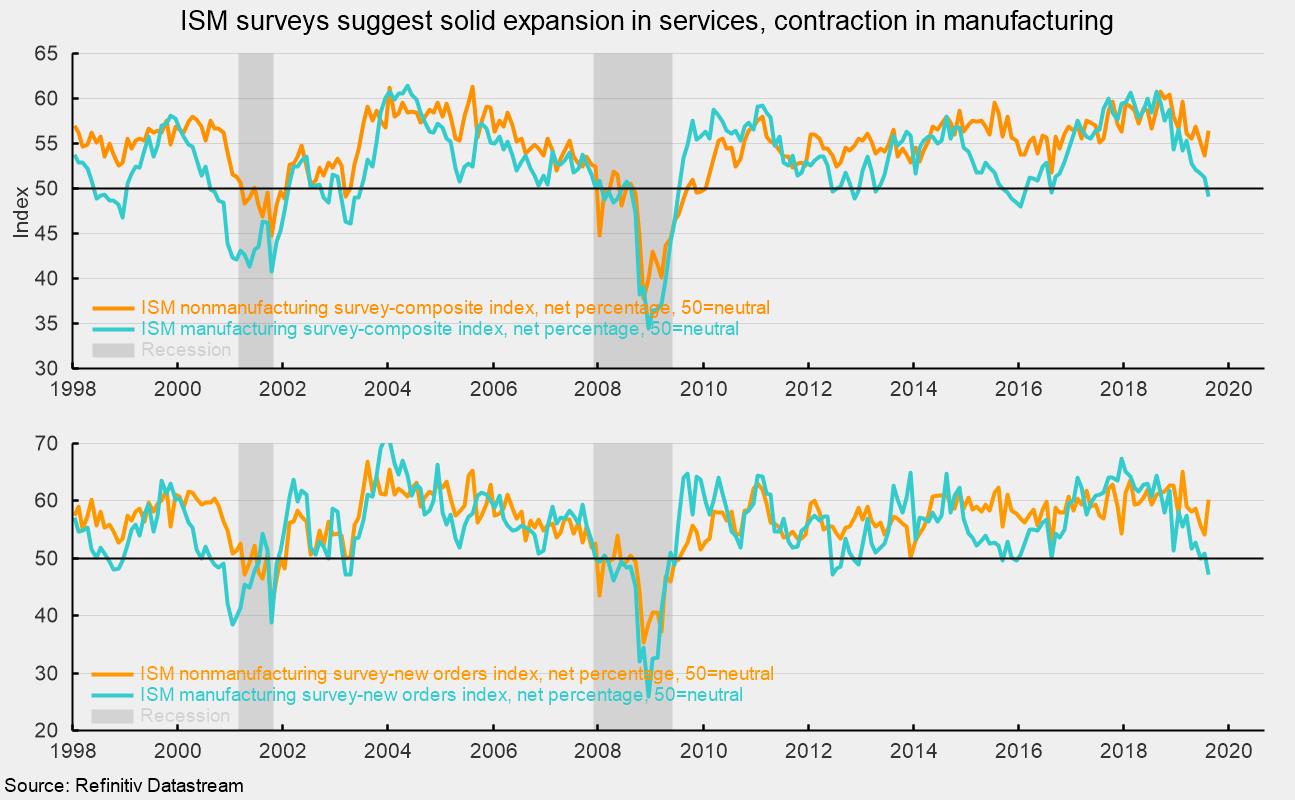
The Institute for Supply Management’s nonmanufacturing composite index rose to a reading of 56.4 from 53.7 in July (see top chart). For this index, 50 is neutral, with readings above 50 suggesting expansion and readings below 50 suggesting contraction. Typically, the nonmanufacturing index ranges between 50 and 60, with dips below 50 during recessions. Historically, readings above 48.6 have suggested expansion of the overall economy. The August result is the 115th consecutive month above 50 and the 121st month of expansion. This stands in sharp contrast to the ISM Manufacturing Purchasing Managers’ Index, which fell below 50 in August, the first reading below neutral in three years (see top chart again).
Among the key components of the nonmanufacturing index, the business-activity index (comparable to the production index in the ISM manufacturing report) was 61.5 in August, up sharply from 53.1 in July. For August, 14 industries in the nonmanufacturing survey reported growth while 1 reported contraction.
The nonmanufacturing new-orders index came in at 60.3, up sharply from 54.1 in July (see bottom chart). August was the 121st month with readings above 50. The rebound suggests diverging paths for services versus manufacturing, where the new-orders index fell below neutral in August.
The new-export-orders index, a separate index that measures only orders for export, was 50.5 in August and has been above 50 for 31 consecutive months. The weak result is consistent with slowing global economic activity and deteriorating trade relations.
The nonmanufacturing employment index decreased to 53.1 in August from 56.2 in July. The still-favorable reading suggests services-sector employment likely increased in August though the pace may have slowed. However, payroll processor ADP released its estimate of private nonfarm payrolls, projecting a strong 195,000 new jobs for the month. The Bureau of Labor Statistics will be releasing its own employment report for August on Friday, September 6.
Supplier deliveries, a measure of delivery times for suppliers to non-manufacturers, came in at 50.5, down from 51.5 in July. It suggests suppliers are falling further behind in delivering supplies to non-manufacturers though the slippage has decelerated a bit from the prior month.
The one component that had been raising concerns in the nonmanufacturing report is the prices index. It had been bouncing around in the 60–65 range from September 2017 through November 2018, but it has fallen below 60 for nine consecutive months, posting a reading of 58.2 in August. This result suggests non-manufacturers are experiencing materials-costs increases but that the pressure may be a bit less than last year. Some of the price pressure is likely due to escalating tariffs.
Today’s report from the Institute of Supply Management suggests that growth reaccelerated in the nonmanufacturing sector in August. The results stand in sharp contrast to the weak results of the ISM manufacturing survey released earlier this week. The services sector of the economy continues to be the main source of growth while manufacturing industries struggle with erratic trade policies and weak global growth.


