Inflationary Inflection Point or Temporary Blip?


In this article I look at the longer-term prospects for inflation in the US. The lockdown decline and subsequent recovery in GDP growth, together with the concomitant fall and rise in prices is already evident. Meanwhile, the forward-looking stock market continues to travel hopefully, anticipating the end of restrictions and a return to the new normal. The bond market, by contrast, may be starting to express fears that the largest peacetime stimulus in history might have longer-term inflationary consequences.
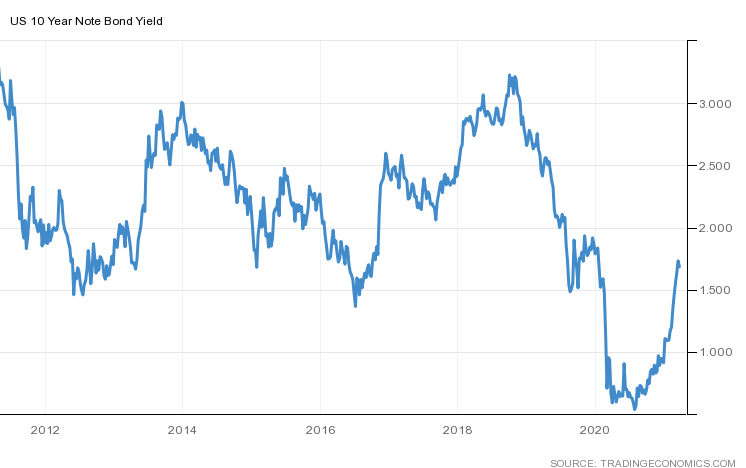
Since making all-time low yields in August 2020, US 10yr Treasury Bond yields have risen steadily, but, as the chart below reveals, only back to the depressed levels of H2, 2019 and mid-2016. Is this a post-lockdown correction or an inflection point, or is it too soon to say?
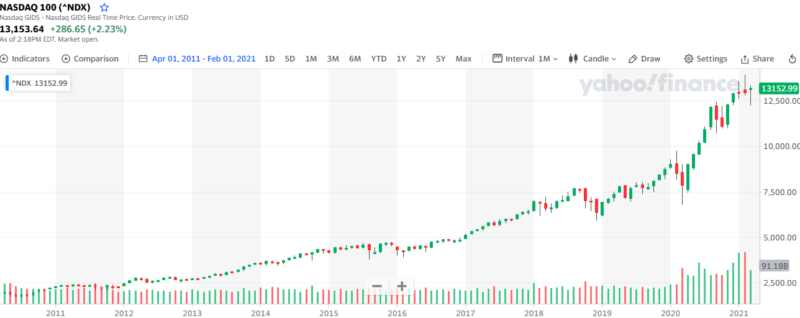
The high growth stocks which dominate the Nasdaq 100 index briefly took fright, in some cases retreating by more than 30%, but the broader index rapidly regained composure. As the next chart (22nd March) shows it is presently just 5.2% below its all-time high. Looked at over the past decade, one could be forgiven for thinking the recent retracement is simply some overdue profit-taking in an otherwise unblemished multi-year bull-market: –
The broader-based S&P 500 Index remains staunchly within striking distance of its all-time high made on 17th March. So, why is the financial press awash with talk of tightening despite assurances from Federal Reserve (Fed) Chairman Jerome Powell to the contrary? The main reason is a belief, especially among the ranks of the so-called bond vigilantes, that the combined monetary and fiscal stimulus which mitigated the immediate economic impact of the pandemic will, as the global economy rebounds, lead to structurally higher prices for goods and services.
‘Inflation is always and everywhere a monetary phenomenon in the sense that it is and can be produced only by a more rapid increase in the quantity of money than in output.’
Milton Friedman
When Friedman wrote about the variable lags between increases in the monetary base and inflation, it was an era of relatively stable velocity of monetary circulation. By contrast, over the past two decades that velocity has fallen steadily: –
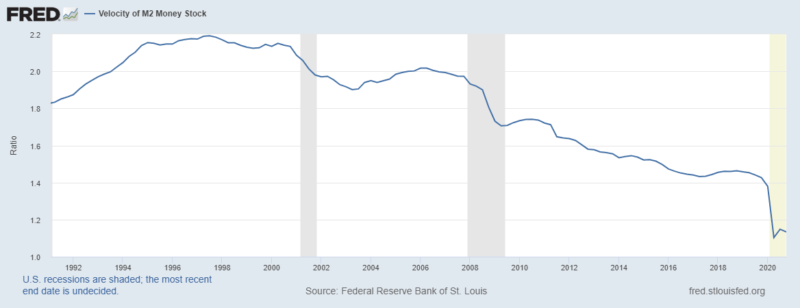
Bond yields may have risen but there is scant evidence of a rebound in the velocity of monetary circulation. The end of the lockdowns may see velocity return to its trend, but the trend has yet to turn; what factors could make this the inflation inflection point?
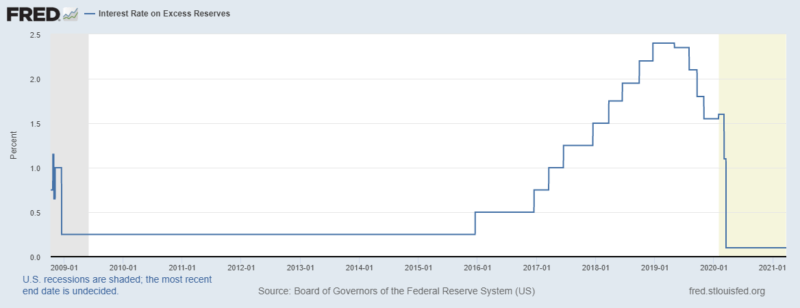
We need look no further than AIER’s Gregg van Kipnis who, on 17th March, published a fascinating analysis entitled Inflation Outlook: Likely Worse Than Expected. The author examines the reasons behind the absence of inflation, despite the excessively accommodative monetary policy of the last decade. He argues that a key factor was the introduction of IOER – interest on excess reserves held at the Fed – which effectively sterilised a large proportion of the newly created monetary balances. For a detailed explanation of the Fed policies – Why did the Federal Reserve start paying interest on reserve balances held on deposit at the Fed? Does the Fed pay interest on required reserves, excess reserves, or both? What interest rate does the Fed pay? from FRBSF is a good starting point.
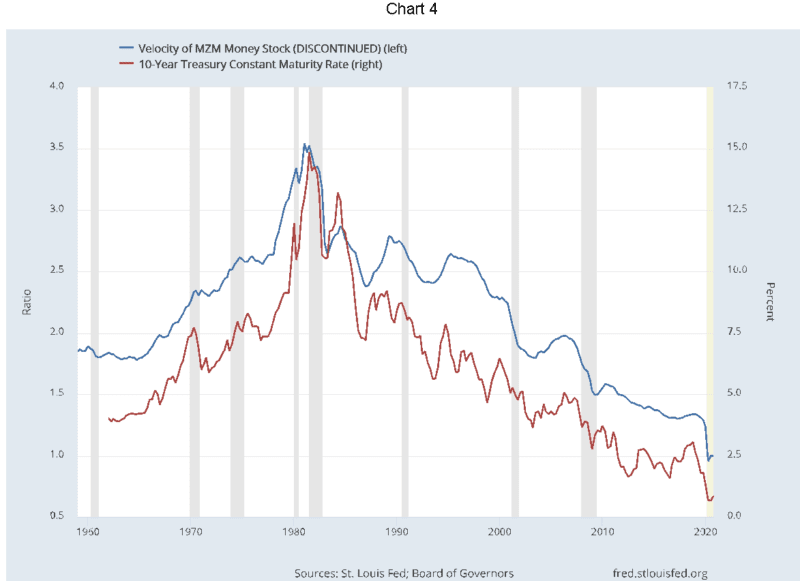
Van Kipnis argues that the declining velocity of circulation in the face of rising money supply is also a function of the lack of opportunity in the real economy. This anaemic investment environment is also reflected in the flatness of the US yield curve. In the chart below, van Kipnis shows the closeness of the relationship between the velocity of circulation and falling bond yields: –
The FOMC statement from March 17th gave upward revisions of their GDP and inflation (PCE) forecasts for Q4 – to 6.5% and 2.2% respectively, but reiterated that monetary policy remains unchanged: –
The Committee decided to keep the target range for the federal funds rate at 0 to 1/4 percent and expects it will be appropriate to maintain this target range until labor market conditions have reached levels consistent with the Committee’s assessments of maximum employment and inflation has risen to 2 percent and is on track to moderately exceed 2 percent for some time. In addition, the Federal Reserve will continue to increase its holdings of Treasury securities by at least $80 billion per month and of agency mortgage‑backed securities by at least $40 billion per month until substantial further progress has been made toward the Committee’s maximum employment and price stability goals.
This echoes a recent speech – How Should We Think about Full Employment in the Federal Reserve’s Dual Mandate? – given by Fed Governor Lael Brainard: –
Inflation remains very low, and although various measures of inflation expectations have picked up recently, they remain within their recent historical ranges. PCE (personal consumption expenditures) inflation may temporarily rise to or above 2 percent on a 12-month basis in a few months when the low March and April price readings from last year fall out of the 12-month calculation, and we could see transitory inflationary pressures reflecting imbalances if there is a surge of demand that outstrips supply in certain sectors when the economy opens back up. While I will carefully monitor inflation expectations, it will be important to see a sustained improvement in actual inflation to meet our average inflation goal.
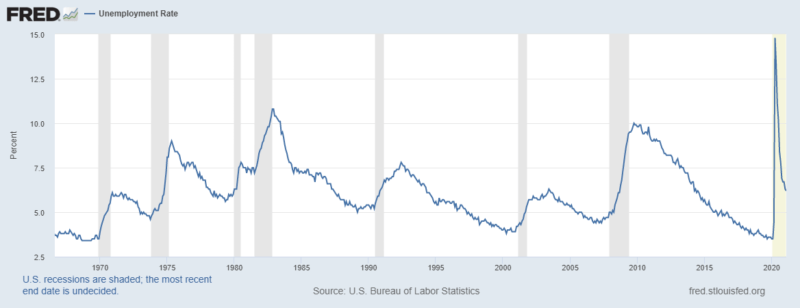
This speech is principally concerned with that other element of the Fed’s dual mandate, the maintenance of full employment. They do not specify a target for unemployment but consensus suggests 3.5% should suffice – that is a level reached in September 2019 and February 2020: and prior? Not once since December 1969: –
Fed guidance suggests that they intend to be reactive rather than proactive where inflation is concerned. Papers, such as – Did the Federal Reserve Anchor Inflation Expectations Too Low? – simply reinforce this impression. They anticipate a sharp economic recovery once vaccinations permit businesses to reopen. Once the bottlenecks ease and the wave of pent-up demand has subsided, however, they fear a further slowdown. The yield switch over between 2yr, 5yr and 10yr Treasury Inflation-Protected Security (TIPS) reflects this view: –
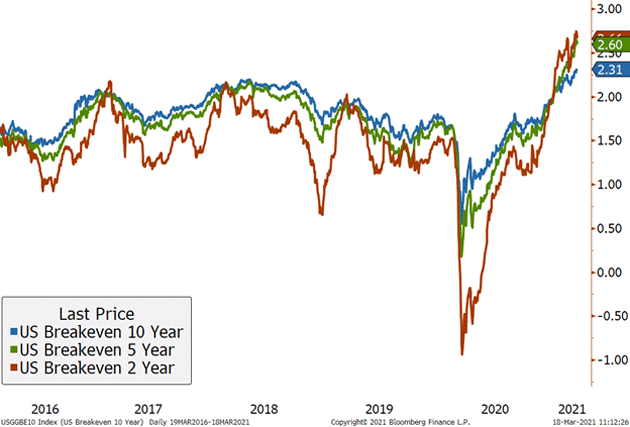
The breakeven inflation shown in the chart above is calculated by taking the yield on a conventional bond minus the yield on an inflation-indexed bond of the same maturity. For further insight into this topic – The Persistent Compression of the Breakeven Inflation Curve – provides a wealth of information. Here are the authors’ conclusions: –
…we document two striking properties of the forward breakeven inflation curve over the last seven years: (1) a persistent level shift down and (2) cross-sectional compression. Going forward, it will be interesting to see if these features of the markets change, perhaps because of investors’ responses to the FOMC’s new flexible average inflation targeting framework, and what that implies for our understanding of this unprecedented behavior.
Perhaps the Fed is winning the war of words, but in – Bond markets are shrugging off inflation fears, but what do they know that we don’t? – The Peterson Institute cautions against relying on the predictive power of inflation breakevens.
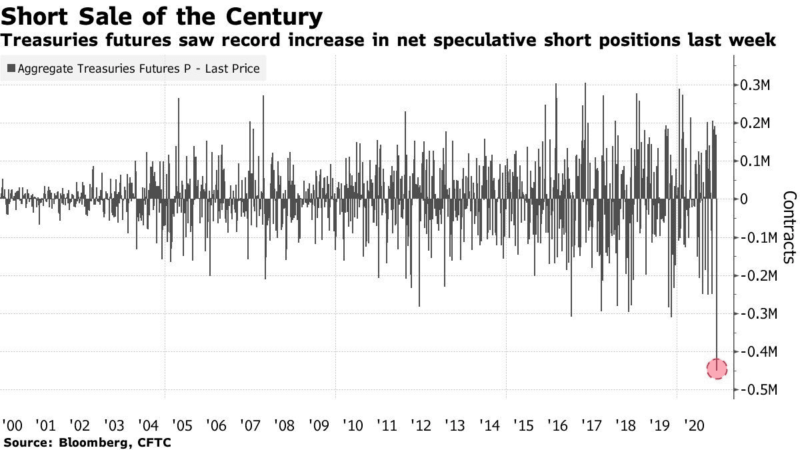
Meanwhile in conventional Treasury securities bearish speculation is rife – short interest briefly reached a 20-year record in early March: –
The repo rate for US 10yr on-the-run T-Bonds traded briefly at -4.25% – in other words borrowers of securities, such as hedge funds, were prepared to lend their cash for free and pay an additional borrowing fee of 4.25% in order to secure 10yr T-Bonds to sell short. For a more detailed explanation of repo rates, this 2004 New York Fed paper – Repurchase Agreements with Negative Interest Rates – may be of interest. What seems evident is that long dormant inflation expectations may be beginning to rise.
Van Kipnis argues that the low level IOER (0.10%) will help to underpin a structural increase in the velocity of circulation: –
Nonetheless, despite Chairman Powell’s pronouncements, there is a tightening of monetary conditions due on March 31st as the temporary change to the Fed’s supplementary leverage ratio (SLR) for bank holding companies expires. This temporary measure has permitted banks to exclude Treasury securities and deposits from SLR calculations for the past year. From April banks’ capacity to provide credit and liquidity to financial markets will be reduced. This New York Fed, Liberty Street post – Did Dealers Fail to Make Markets during the Pandemic? – provides more information.
Beyond Normalisation
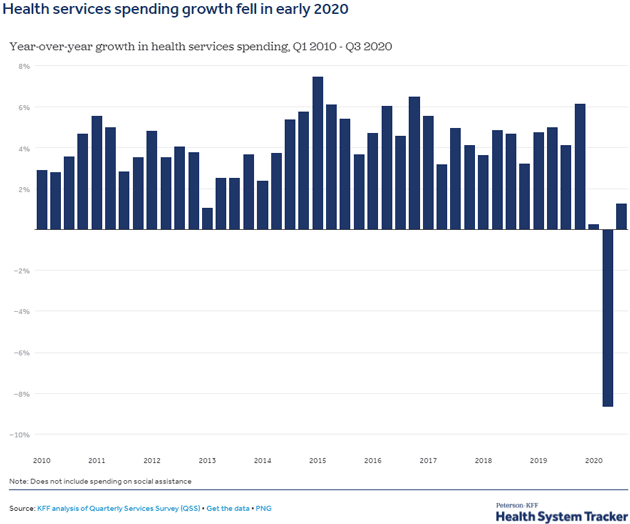
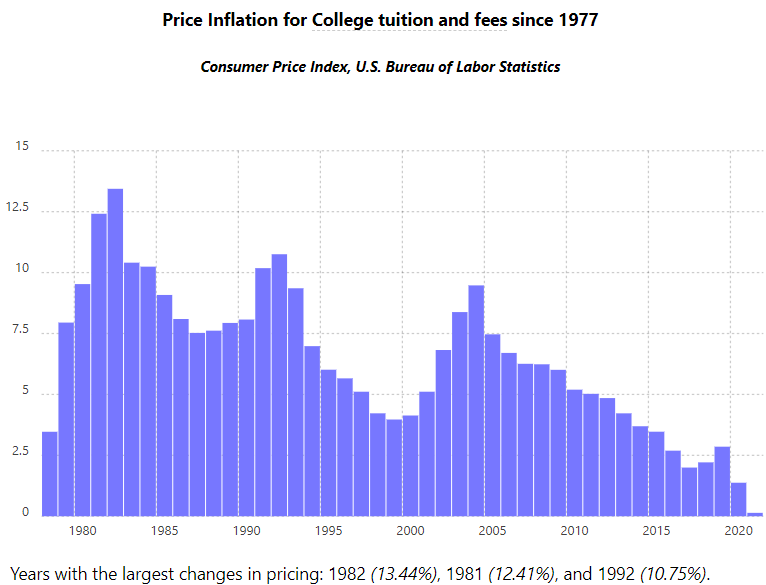
Looking beyond the current recovery there are two forces which persuade me that the inflation genie may have emerged from its bottle. Firstly the persistent official under-measurement of inflation. This is most noticeable in US housing costs and healthcare but is evident, to a lesser degree, in education: –
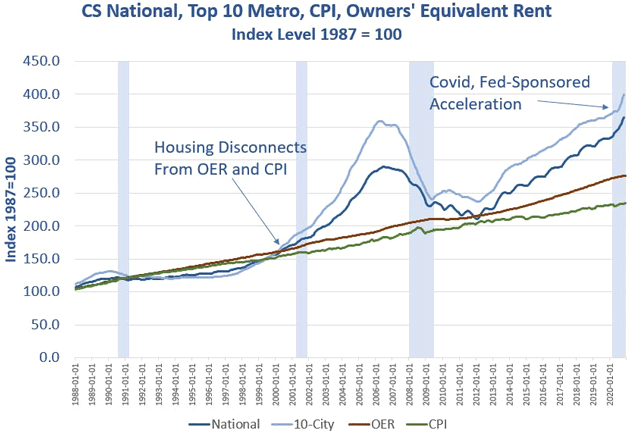
With housing we see a divergence which has been widening since 2000 and has accelerated since 2012.
Meanwhile, as the US population ages, healthcare costs have risen faster than implied by CPI or PCE: –
The chart below shows college tuition inflation since the 1980’s; last year’s decline was primarily due to the lockdowns: –
As the next chart reveals, the systemic under-measurement of inflation inherent in both the CPI and PCE measures permits the Fed to justify setting policy rates too low: –
This chart from Shadow Stats shows the way inflation measurement, compared to the official method used in the 1980’s, has diverged: –
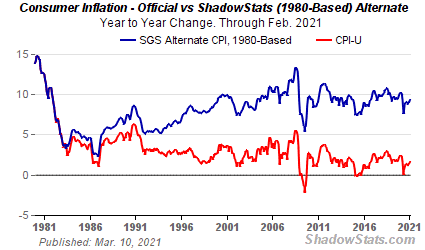
A full explanation of the methodology used can be found here. The public is already aware of the disconnect between official data and individual experience, but as prices, even as measured by PCE, start to rise, anger at this egregious inflation fiction will grow.
The Demographic Twist
The second factor which will support higher inflation is the aging of the population of both developed and developing countries. Writing in September 2020 Charles Goodhart and Manoj Pradhan provided a precis of their new book. The article, entitled, The great demographic reversal and what it means for the economy – begins by addressing the outlook for China, concluding that its greatest contribution to global growth is already past, since the size of its working age population has begun to decline. They go on to observe that in countries with a shrinking working age population: –
The great demographic reversal will lead to a return of inflation, higher nominal interest rates, lessening inequality and higher productivity, but worsening fiscal problems, as medical, care and pension expenditures all increase…
The authors predict that output growth will decline as the ratio of workers to retirees diminishes. Any increase in longevity without significant breakthroughs in healthcare will be a burden on the affected old, their families and the state. If fertility rates continue to decline, carers, already in short supply, will be in even higher demand. The authors are convinced that the combination of these demographic forces with the continued reversal of globalisation will presage the return of structurally persistent inflation. This combination of cost-pull and price-push inflation will cause interest rates to rise, but not necessarily as fast as inflation. The inflation will also be felt unevenly across society, exacerbating political polarisation.
Goodhart and Pradhan focus specifically on the fortunes of the UK economy, concluding: –
From 1750 until 1950 inflationary expectations, and nominal and real interest rates, remained roughly constant, in the UK at least, while inflation was a function of occasional wars and the vagaries of harvest. After the 1950s there was a strong upwards trend in inflation, inflationary expectations and nominal interest rates (1950 – 1980), followed by an extraordinary downwards trend in inflation, inflationary expectations and both nominal and real interest rates (1980 – 2020). The earlier trend can be ascribed to a doomed, but well intentioned, attempt to keep unemployment below its rising natural rate, with the monetary regime allowing that to happen. We ascribe the subsequent downwards trend to underlying demography and globalisation factors. Given the expansionary intent of monetary policies, it is hard to claim that such disinflation was a monetary phenomenon. But in that case the forthcoming reversal of the previous demographic and globalisation trends should lead to a revival of inflation and nominal (but not necessarily real) interest rates.
The US may have better demographics than many developed nations but the trend towards individual spending rather than saving will still have inflationary consequences.
Since 2008 we have seen the shortening of global supply chains, and protectionist policies have stalled the process of globalisation. Immigration has become more contentious as the nature of work has become more transitory and older workforce participation has risen: –
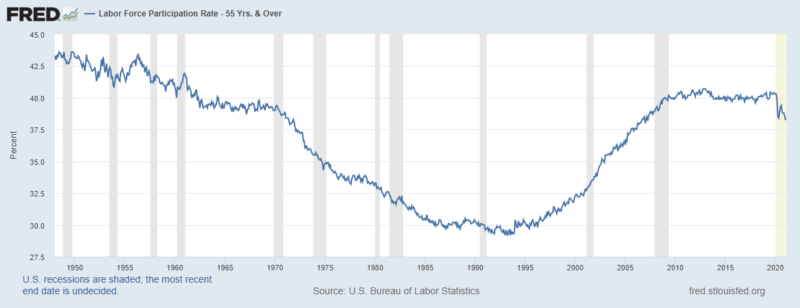
For two decades until 2010 older workers delayed retirement. Since 2010 their cohort has marked time, looking ahead, however, they cannot indefinitely postpone the inevitable.
…But all the clocks in the city
Began to whirr and chime:
‘O let not Time deceive you,
You cannot conquer Time.
W.H. Auden
Conclusion
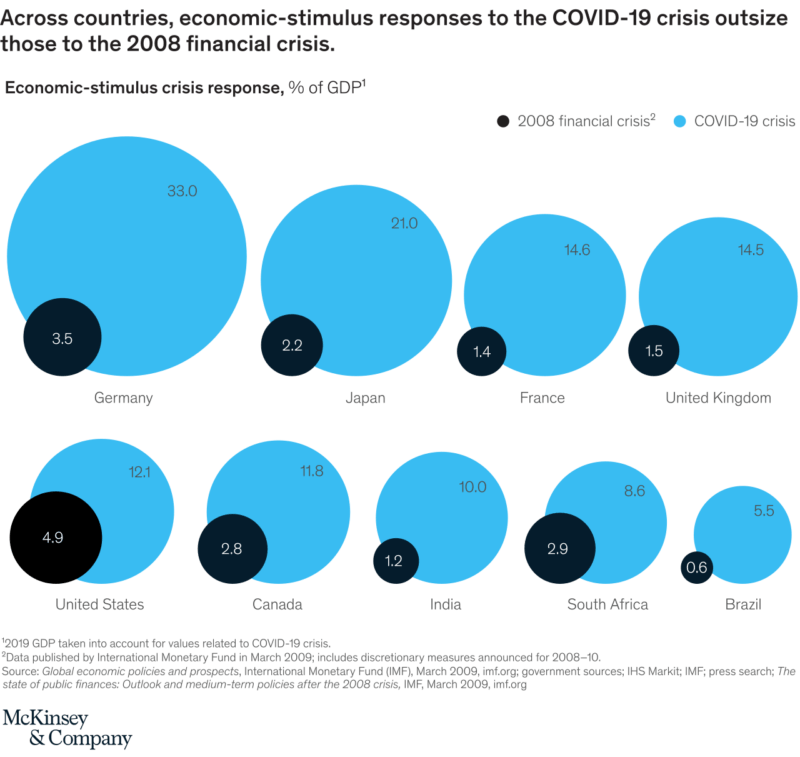
The question that I asked at the beginning of this article was whether or not we have reached an inflation inflection point. My answer is a qualified ‘yes,’ but this is as much a function of the scale of the fiscal and monetary response to the lockdowns as it is a turning point. For a brilliant (Austrian Economic) analysis of the global economic impact of the lockdowns, Jesus Huerta de Soto’s – Economic Effects of Pandemics – is a tour de force. From a monetary perspective, however, this infographic, showing a comparison between the scale of 2020 and the response to the Great Financial Recession, is instructive: –
Demographic forces are definitely at work but they will take time to become apparent. The fastest-aging country, Japan, continues to be the experimental petri dish of central bank policy – their romance with yield curve control, pivoting around a 10yr JGB yield of zero, has not yet palled. How the Fed Managed the Treasury Yield Curve in the 1940s – tells the story of the US experiment with something similar between mid-1942 and February 1950.
The Biden administration is preparing a Green New Deal along the lines of FDR’s policy of the 1930’s. These proposals spell higher regulatory costs for traditional energy producers: in this more protectionist era, these measures will be inflationary. However, if the Fed continues to purchase $120bln or more in Treasury bonds and mortgage-backed securities monthly they may succeed in stalling the rise in long-term yields. The yield curve will remain too flat and the malinvestments, which emanate from an artificially low long-term cost of funding, will continue to proliferate. If bond yields cannot rise, the stock market will remain supported unless stagflation sets in. Should that transpire, the Fed will need to decide whether to ignore inflation and increase monetary stimulus, including the purchase of ETFs and common stock, in order to maintain full employment, or ‘hold’ and witness a politically unpalatable clearing of both the stock and bond market.
Colin Lloyd

Colin is a macroeconomic commentator, writer and presenter, based in London, England. He has worked for asset managers in commodities, money markets, capital markets, equities and foreign exchange since the early 1980’s and writes In the Long Run. He is a contributor to several free-market publications including The Cobden Centre and was a 2017 runner-up for the 2017 Richard Koch Breakthrough Prize awarded by The Institute of Economic Affairs.