Housing Remains a Bright Spot for the Economy

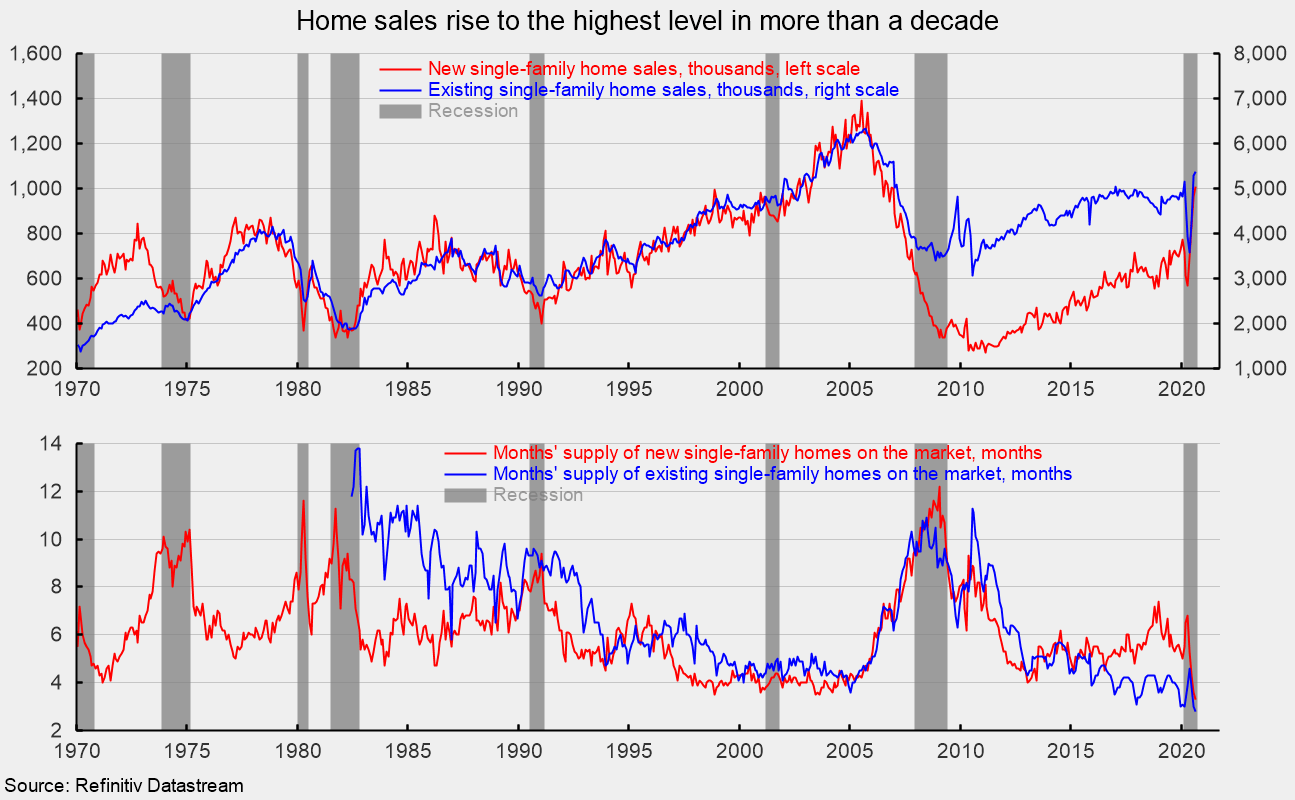
Sales of new single-family homes rose to the fastest pace since September 2006. Total sales rose 4.8 percent in August to a 1.011 million seasonally adjusted annual rate and are up an astonishing 43.2 percent from a year ago (see top chart).
Sales rose in two of the four regions tallied: sales surged 13.4 percent in the South – the largest region by sales volume – putting sales 50.0 percent above year-ago levels while sales were up 5.0 percent in the Northeast, leaving that region’s sales rate 27.3 percent above the year-ago pace. However, sales were down 21.4 percent in the Midwest (but still 54.7 percent above year-ago levels) and sales in the West decreased 3.1 in August and were 13.2 percent below the year-ago level.
Total inventory of new single-family homes for sale declined 3.1 percent to 282,000 in August, the fifth decrease in a row, leaving the months’ supply (inventory times 12 divided by the annual selling rate) at 3.3 – a record low, down 8.3 percent from July’s 3.6 months, and 40.0 percent below the year-ago level (see bottom chart).
Sales in the market for existing single-family homes rose 1.7 percent in August, coming in at a 5.37 million seasonally adjusted annual rate (see top chart). From a year ago, sales are up 11.0 percent. The August pace is the highest since December 2006 (see top chart).
By region, sales for existing single-family homes were up in three of four regions and flat in the fourth: sales were up 12.3 percent in the Northeast and are up 8.5 percent from the year-ago level; sales rose 0.9 percent in the West, leaving that region’s sales rate 9.9 percent above the year-ago pace; sales gained 0.8 percent for the month in the Midwest and are 9.0 percent above the August 2019 rate; and sales were unchanged in the South, leaving sales 13.4 percent above year-ago levels.
The existing single-family home segment saw inventory fall 2.3 percent to 1.27 million, pushing months’ supply to 2.8 from 3.0. Months’ supply for the existing single-family segment is also at a new record low (see bottom chart).
Robert Hughes

Robert Hughes joined AIER in 2013 following more than 25 years in economic and financial markets research on Wall Street. Bob was formerly the head of Global Equity Strategy for Brown Brothers Harriman, where he developed equity investment strategy combining top-down macro analysis with bottom-up fundamentals. Prior to BBH, Bob was a Senior Equity Strategist for State Street Global Markets, Senior Economic Strategist with Prudential Equity Group and Senior Economist and Financial Markets Analyst for Citicorp Investment Services. Bob has a MA in economics from Fordham University and a BS in business from Lehigh University.


