February 2020 Business Conditions Monthly

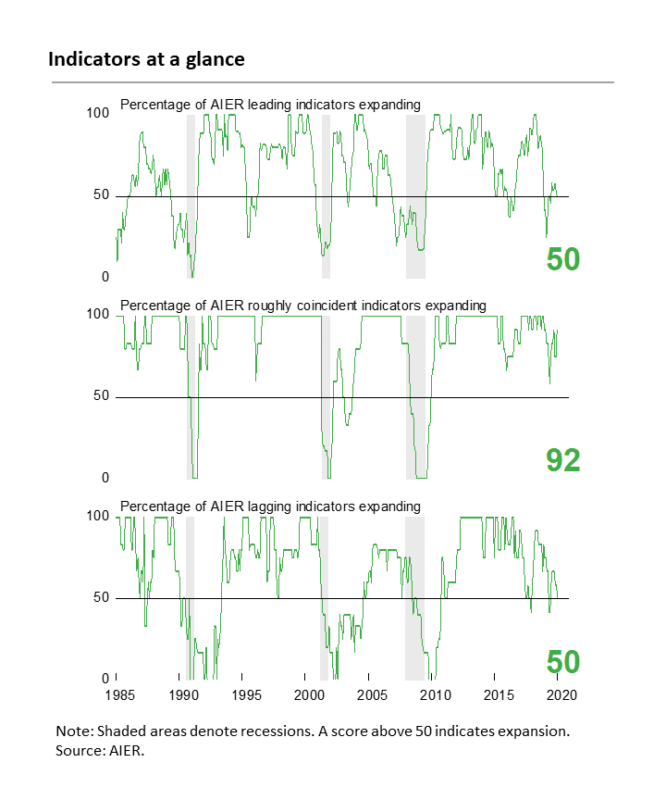
A decline for the AIER Leading Indicators index leaves the index at a neutral 50 for January.
AIER’s Business Cycle Conditions Leading Indicators index fell another 4 points in January, falling to a neutral 50 reading. The latest result was the lowest reading since July 2019. The Roughly Coincident Indicators index rose to 92 from 75 in December while the Lagging Indicators index fell 8 points to 50 (see chart).
The neutral reading for the Leading Indicators Index reflects the varied strength among the major sectors and overall slow pace of growth for the economy. Fourth quarter real gross domestic product rose at a 2.1 percent annual rate, matching the third quarter performance. The modest growth in real gross domestic product in the fourth quarter was driven by a slower pace of growth in real private domestic demand (consumer spending, business fixed investment, and residential investment) combined with a small positive contribution from exports, a large positive contribution from a sharp drop in imports (which are used in the calculation of real gross domestic product) and an increase in government spending. Partially offsetting these was a sharp slowdown in inventory accumulation.
Politics and policy uncertainty continue to represent risks to consumer and business confidence, and given the modest pace of economic expansion, it would not take much to reduce growth to zero. The recent outbreak of the coronavirus is also disrupting economic activity globally. It’s too early to gauge the magnitude of the impact, but the outbreak is another risk to global economic expansion. Overall, the U.S. economy continues to expand but remains vulnerable to erratic policies, political partisanship, and global economic risks.
The AIER Leading Indicators index came in at a neutral 50 reading with the 12 indicators evenly split between positive and negative trends.
The AIER Leading Indicators index declined by 4 points for the second month in a row, coming in at a neutral 50 in January. The index has been range bound between 45 and 58 for 9 consecutive months and hasn’t been above 60 since November 2018. The extended period of close-to-neutral results are consistent with the overall mixed performance of the various sectors of the economy. The results suggest continued economic expansion albeit at a moderate pace and with a heightened degree of uncertainty. Overall, the 12 indicators were evenly split with six positives and six negatives; no indicators were neutral.
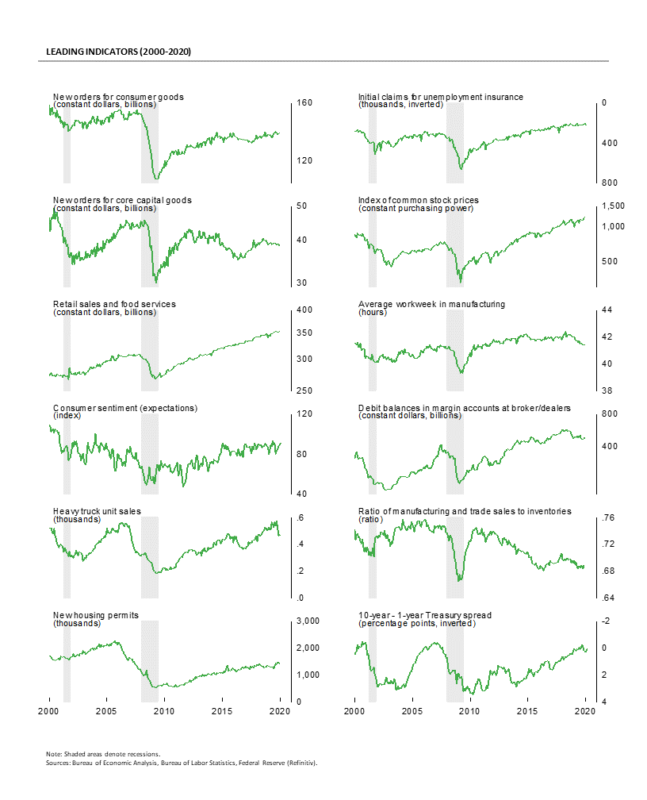
Three of the 12 leading indicators changed direction in January with two moving to negative trends and one indicator improving to a positive trend. Real new orders for core capital goods and the 10-year–1-year Treasury yield spread moved to negative trends from neutral trends in December. Total heavy-truck unit sales, the ratio of manufacturing and trade sales to inventory, the average workweek in manufacturing, and debit balances in customers’ margin accounts maintained unfavorable trends.
The University of Michigan index of consumer expectations improved in January, turning to a positive trend in December. Positive trends were maintained in January by initial claims for unemployment insurance, real retail sales and food services, real new orders for consumer goods, housing permits, and real stock prices.
Overall, the Leading Indicators index came in right at the neutral 50 level, continuing a run of very modest readings. The extended run of close-to-neutral results combined with other mixed data and policy uncertainty suggest a high degree of caution remains warranted.
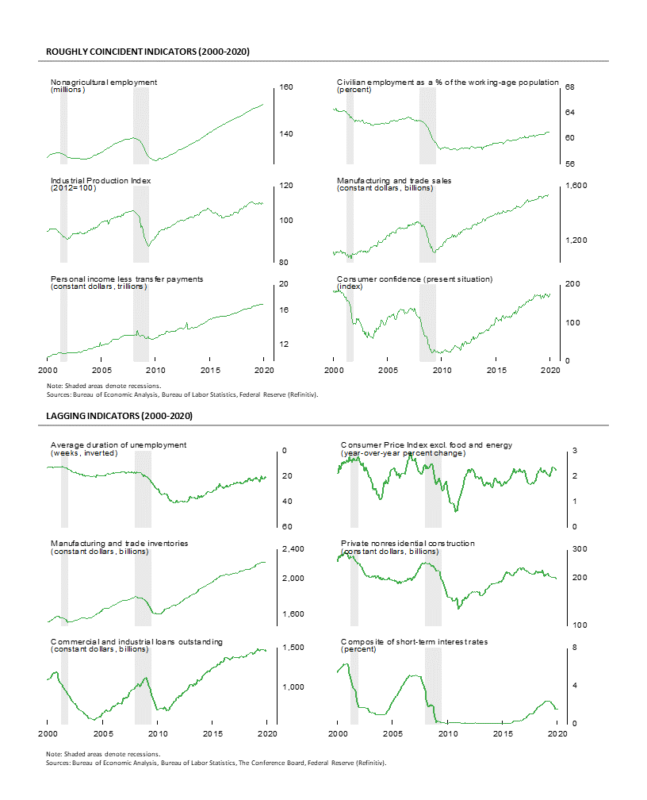
The Roughly Coincident Indicators index rose to 92 in January from 75 in December. Two indicators improved in January with industrial production moving to a neutral trend and The Conference Board index of consumer confidence for the present situation moving to a positive trend. Overall, five of the six roughly coincident indicators were trending favorably while one was neutral, and none were trending unfavorably.
Historically, this index frequently posts readings of 100 late in economic expansions but hasn’t seen a perfect score since December 2018. Over the last 13 months, since the last 100 reading, the index has registered 92 four times but also fallen as low as 58. The average over that period is just 81. The less-than-robust results confirm the mixed performance of the economy.
AIER’s Lagging Indicators index fell to 50 in January, the lowest reading since June 2019. One indicator, commercial and industrial loans, worsened in January, falling to a negative trend. Overall, three of the six lagging indicators were trending higher, three were trending lower, and none were in a neutral trend.
Real gross domestic product grew at the slowest pace since 2013
Real gross domestic product rose at a 2.1 percent annualized rate in the fourth quarter, the same pace as in the third quarter, according to the Bureau of Economic Analysis. Measured from fourth quarter 2018 to fourth quarter 2019, real gross domestic product increased 2.3 percent versus 2.5 percent for the four quarters of 2018. For calendar year 2019, real gross domestic product grew 2.3 percent, the slowest pace since 2013.
Domestic demand components were even weaker
Real final sales to private domestic purchasers, a key measure of private domestic demand, rose at a meager 1.4 percent annualized rate in the fourth quarter, down from a 2.3 percent pace in the third quarter. The fourth-quarter gain was the slowest pace since 2015. Over the last four quarters, the pace of growth was 2.2 percent, matching the third quarter pace and the slowest since 2013. Among the major components, real consumer spending rose but at a slower pace, business fixed investment fell, but residential investment posted its third quarterly gain.
Consumers remain the engine of growth
Real consumer spending decelerated in the fourth quarter, rising at a 1.8 percent annualized pace following robust gains of 3.2 percent and 4.6 percent in the third and second quarters, respectively. The deceleration was broad-based with durable-goods spending up 2.1 percent versus 8.1 percent in the third quarter, nondurable-goods spending up 0.8 percent versus 3.9 percent, and services gaining 2.0 percent versus 2.2 percent previously. Real consumer spending contributed 1.2 percentage points of the 2.1 percent real-gross domestic product growth rate.
Monthly retail sales and food services rose 0.3 percent in December, following a 0.3 percent rise in November. Over the past year, they are up 5.8 percent. Core retail sales, which excludes motor vehicles and gasoline, rose 0.5 percent in December following a 0.2 percent decline in November. From a year ago, core retail sales are up 5.7 percent. Unit-auto sales fell 2.3 percent in December, selling at a 16.7 million annualized pace. Unit sales have been in the 16 to 18 million range since 2014. Sales are dominated by the light-truck segment including sport utility vehicles and pick-up trucks, which sold at a 12.2 million pace while car sales came in at a 4.5 million pace. That puts the light-truck share at 72.8 percent in December, down from 73.8 percent in November but up from 70.2 percent in December 2018 and well above the less-than-50 percent share in 2000.
New orders for consumer goods rose 0.9 percent in December following an 0.8 percent gain in November. For all of 2019, new orders posted a meager 0.5 percent gain versus 2018. Among the major components, orders for consumer durable goods fell 1.1 percent in December following a 0.3 percent rise in the prior month. Nondurable consumer-goods orders increased 1.4 percent for the month of December following a 0.9 percent increase. For the full year, consumer durable-goods orders were up 1.9 percent while consumer nondurable-goods orders gained just 0.1 percent.
Business investment declined again
Business fixed investment fell at a 1.5 percent annualized rate in the fourth quarter, the third quarterly decline in a row. At annualized rates, the decline was led by a 10.1 percent fall in spending on structures while spending on equipment declined at a 2.9 percent annual pace, the third drop in the last four quarters. Investment in intellectual property rose 5.9 percent following a 4.7 percent pace in the third quarter; the gain extends to 12, the number of consecutive quarterly increases in investment in intellectual property products. Overall, real business investment subtracted 0.20 percentage points from real gross domestic product growth versus a 0.31 percentage-point reduction in the third quarter.
New orders for capital goods jumped 5.9 percent in December, rebounding from a 10.9 percent plunge in November. Nondefense capital goods orders excluding aircraft, a proxy for business capital equipment expenditures, fell 0.8 percent in December after no change in November. Businesses appear to be taking a cautious approach to capital investment.
Inventory accumulation by businesses continued in the fourth quarter but at a sharply slower pace compared to the third quarter, subtracting 1.09 percentage points from fourth-quarter growth.
Housing investment rises but so do inventories
Residential investment, or housing, rose at a 5.8 percent pace in the fourth quarter compared to a 4.6 percent pace in the prior quarter. Housing has risen for two consecutive quarters following declines over the prior six quarters and eight of the last nine quarters. Residential investment added 0.21 percentage points to real gross domestic product growth in the fourth quarter.
Housing permits, an indicator of future construction activity, fell 3.9 percent in December. The fall was led by an 11.1 percent plunge in multifamily (5+ units) permits while the single-family category, which accounts for about two-thirds of total permits, fell 0.5 percent for the month.
Sales of new single-family homes fell 0.4 percent in December. Sales came in at 694,000, down from 697,000 in November. Despite the drop, sales are still up 23.0 percent from a year ago. Total inventory of new single-family homes for sale rose 1.6 percent to 327,000 in December, pushing the months’ supply (inventory divided by the annual selling rate times 12) to 5.7, up from 5.5 months in November. For new single-family homes, months’ supply has been holding above five, a somewhat elevated level, since December 2017.
Plunge in imports impacts GDP calculation
Net trade had a large positive impact on the calculation of real gross domestic product growth in the fourth quarter, adding 1.48 percentage points. Real exports rose at a 1.4 percent pace, adding 0.17 percentage points to overall growth while real imports plunged at an 8.7 percent rate, adding a whopping 1.32 percentage points in the calculation of real gross domestic product. Trade patterns are likely being distorted by disruptions to trade policy, current and threatened, suggesting the significant contribution from declining imports is unlikely to be repeated. The outbreak of the coronavirus is also an unknown for the outlook for global growth.
Government spending still rising along with budget deficits
Government spending rose at a 2.7 percent annualized rate in the fourth quarter compared to a 1.7 percent increase in the third quarter, contributing 0.47 percentage points to growth versus a 0.30 percentage-point contribution in the prior quarter. Federal defense spending rose 4.9 percent while federal nondefense spending rose 1.6 percent. The Federal deficit continues to expand at an unprecedented pace given the record-long economic expansion. Exploding federal deficits remain one of the most significant risks to the medium- and long-term outlook for the economy.
Robert Hughes

Robert Hughes joined AIER in 2013 following more than 25 years in economic and financial markets research on Wall Street. Bob was formerly the head of Global Equity Strategy for Brown Brothers Harriman, where he developed equity investment strategy combining top-down macro analysis with bottom-up fundamentals. Prior to BBH, Bob was a Senior Equity Strategist for State Street Global Markets, Senior Economic Strategist with Prudential Equity Group and Senior Economist and Financial Markets Analyst for Citicorp Investment Services. Bob has a MA in economics from Fordham University and a BS in business from Lehigh University.


