Favorable readings continue for the AIER Leading Indicators Index but Policy Threats Remain High

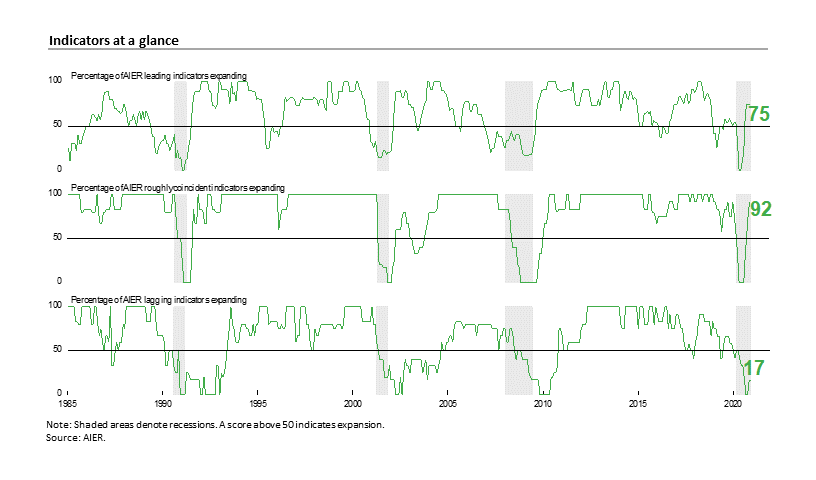
AIER’s Business Cycle Conditions Leading Indicators index held steady at 75 in December. The latest result was the fourth month in a row with the index coming in above the neutral 50 threshold. The Roughly Coincident Indicators index rose to 92 while the Lagging Indicators index was unchanged at 17 (see chart).
The recent run of favorable results for the Leading Indicators Index reflects the ongoing recovery from the dramatic declines in economic activity due to government shutdowns. However, economic data continue to show varied strength among the major sectors of the economy. Furthermore, policies that distort activity are also impacting consumer and business finances. These impacts have the potential to influence economic activity beyond the short-term distortions.
Politics, current policies, and uncertainty over future policy continue to threaten the already-uneven recovery. Overall, the economy continues to expand but remains vulnerable to erratic government policies and political partisanship.
Leading Indicators index remains solidly above neutral
The AIER Leading Indicators index remained unchanged at 75 in December. The December result is the fourth month in a row above the neutral 50 threshold. The index is constructed as a measure of breadth among the individual indicators and does not directly relate to levels of activity or growth rates of activity. However, the results do suggest continued overall economic expansion as three-quarters of the individual indicators are trending higher. In total, 9 of the 12 leading indicators maintained a positive trend in December, with 3 trending lower and none were neutral.
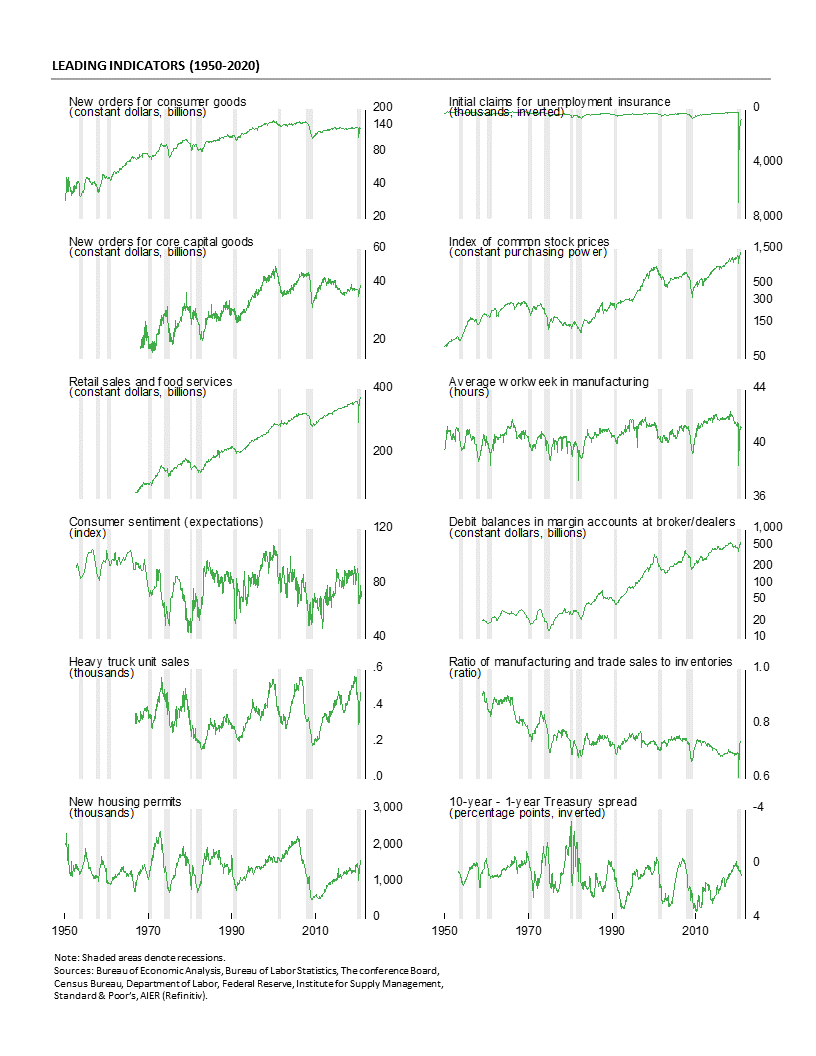
Positive trends occurred for the average workweek in manufacturing, real retail sales and food services, real new orders for core capital goods, real new orders for consumer goods, total heavy-truck unit sales, the ratio of manufacturing and trade sales to inventory, housing permits, debit balances in customers’ margin accounts, and real stock prices. Downward trends came from the University of Michigan index of consumer expectations, initial claims for unemployment insurance, and the 10-year–1-year Treasury yield spread. All 12 indicators were the same in November.
Overall, the Leading Indicators index remains above 50, indicating continued expansion is likely. However, continued policy uncertainty suggests a high degree of caution is warranted.
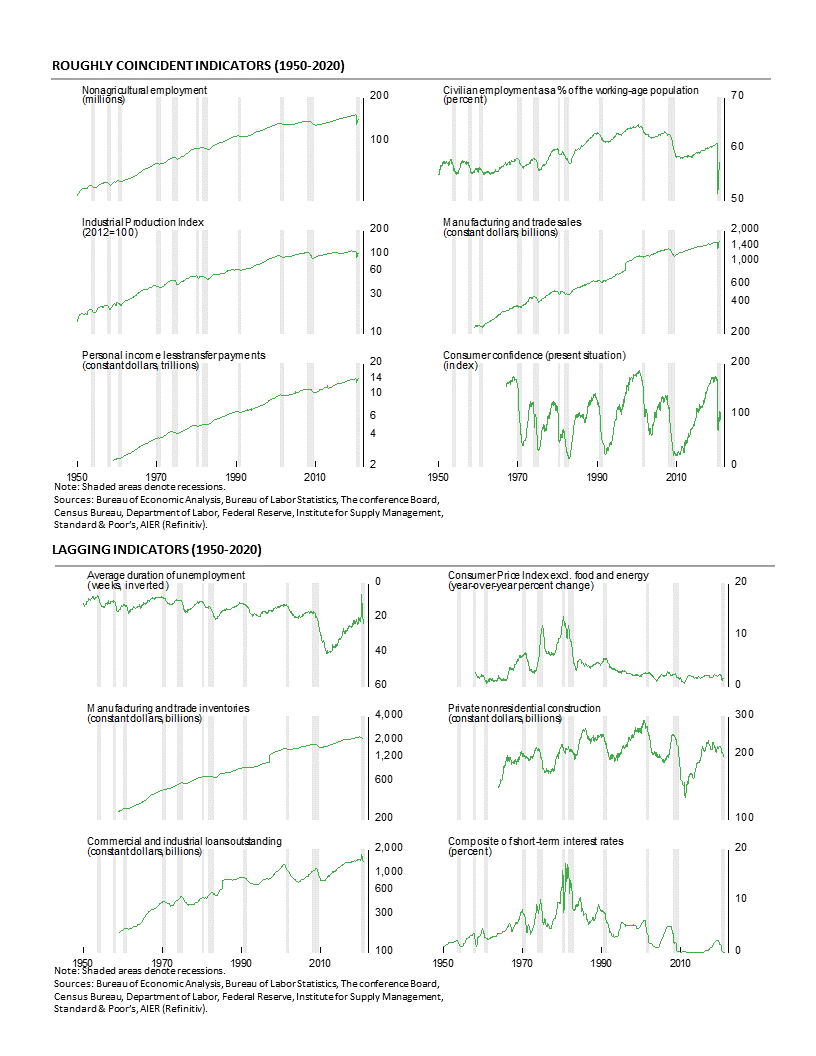
The Roughly Coincident Indicators index rose to 92 in December, following a 75 result in November. This index has risen rapidly from a zero reading as recently as August, with the three most recent months coming in above the neutral 50 threshold. One indicator changed trend in December as the employment-to-population ratio improved from an unfavorable trend to a neutral trend. Overall, five indicators were trending favorably while one was in a neutral trend and none were in an unfavorable trend.
AIER’s Lagging Indicators index held at 17 in December. The back-to-back 17s follow back-to-back zeros in September and October. Three indicators changed trend in the latest month: real manufacturing and trade inventories improved from an unfavorable trend to a neutral trend as did the 12-month percent change in the core Consumer Price Index indicator. Those were offset by a change from a favorable trend to an unfavorable trend for the composite short-term interest rate indicator. The net of the changes among the six indicators left the overall index unchanged, with no indicators trending higher, four trending lower, and two holding in a neutral trend.
Overall, the AIER business cycle–indicator indexes suggest continued economic expansion. However, government policies restricting consumers and businesses remain a threat to future economic growth. Caution is warranted.
Household net worth hits $123.5 trillion in the third quarter
Household net worth reached $123.5 trillion at the end of the third quarter. Total assets were $140.3 trillion, with financial assets at $98.7 trillion, or 70.4 percent of the total, while nonfinancial assets were $41.6 trillion, or 29.6 percent. Total assets increased 3.0 percent for the quarter and were up 7.1 percent from a year ago.
Household liabilities were $16.8 trillion at the end of the third quarter. Mortgage debt was $10.8 trillion, or about 64.2 percent of the total. Total household liabilities increased 1.6 percent for the quarter and were up 3.3 percent from a year ago.
Mortgage debt rose 1.5 percent for the quarter while the value of household real estate rose 1.4 percent. Total owners’ equity in real estate was 65.5 percent of the value of the real estate.
Consumer credit totaled $4.1 trillion, or about 24.6 percent of total household liabilities after a 1.1 percent increase for the quarter. From a year ago, consumer credit is up just 0.5 percent. Total household liabilities were 12.0 percent of total household assets, the lowest ratio since 1983.
Debt service remains low for households
Debt service for households was 9.1 percent of disposable personal income in the third quarter, just slightly above the record-low 8.8 percent in the previous quarter. Debt service peaked at 13.2 percent of disposable income in the fourth quarter of 2007 but fell sharply over the 2008 through 2012 period. The average over the past 40 years is 11.2 percent.
Servicing total recurring financial obligations, a broader measure than debt service that includes rent, auto leases, homeowners’ insurance, and property taxes, totaled 14.3 percent of disposable personal income in the third quarter. That is just slightly above the record low of 13.7 percent in the previous quarter. The average over the last 40 years is 16.3 percent.
Overall, while debt levels are rising modestly, increases in assets are keeping balance sheets strong while the low level of interest rates and rising incomes are keeping debt service low.
Personal savings rate trending higher
The personal savings rate, savings as a percentage of disposable personal income, came in at 12.6 percent in the third quarter as measured by the flow-of-funds report. In the second quarter, the savings rate was 10.0 percent. This measure is broader than the monthly measure from the Bureau of Economic Analysis that is often quoted.
For the third quarter, the personal savings rate was 10.2 percent, down from a government-distorted 32.1 percent in the second quarter. The rate had been trending moderately higher since averaging 8 to 9 percent in 2018. In a longer-term perspective, the three-year average has been bouncing around in the 9 to 12 percent range since the end of the last recession. That is a solid improvement over the 6 to 9 percent range for the 1999 to 2008 period but well below the 15 to 18 percent range that prevailed for most of the period from 1965 through 1990. Once government transfer payments fade, the personal savings rate is likely to drift back closer to the 10 percent area.
Labor Outlook Uncertain
Initial claims for regular state unemployment insurance totaled 787,000 for the week ending December 26, down 3,000 from the previous week’s upwardly revised tally of 790,000. Claims have been in the 700,000 to 1 million range for 19 consecutive weeks after hitting a peak of 6.9 million in March. The four-week average was 818,750, down 18,750 from the prior average. The four-week average has been between 740,000 and 840,000 for 14 consecutive weeks. Prior to the lockdowns, initial claims averaged 212,000 over the first 10 weeks of 2020. Persistent initial claims at such a historically high level remain a threat for the labor market recovery and the economy.
The total number of people claiming benefits in all unemployment programs including all emergency programs was 19.177 million for the week ended December 19, down 419,228 from the prior week. Continuing claims in Federal and state programs are about the same level as in mid-November.
Nonfinancial corporate liabilities-to-assets ratio hits an all-time high
Total liabilities for the nonfinancial corporate sector rose 2.9 percent in the third quarter, less than the 0.9 percent gain in total assets. That result pushed the ratio of liabilities to assets up to 66.2 percent from 64.9 percent at the end of the second quarter.
The new ratio is an all-time high and well above the 25 to 28 percent range during the late 1950s. The liabilities-to-assets ratio rose sharply from the upper 20s in 1960 to just over 60 percent in 2000. The ratio fell sharply in the early 2000s, hitting 49.5 percent in 2006. The ratio has moved sharply higher since 2006 to its current record level.
Some of the increase is likely a reaction to the very low interest rates on newly issued corporate debt as some companies use cheap debt to buy back equity shares. However, even low-rate debt may be a financial risk in times of economic and policy uncertainty. Furthermore, if rates begin to rise, then maturing debt may need to be refinanced at higher rates, hurting profits.
Manufacturing
The Institute for Supply Management’s Manufacturing Purchasing Managers’ Index posted a gain in December, registering a 60.7 percent reading for the month, up from 57.5 percent in November. The latest result is the seventh consecutive reading above the neutral 50 threshold. Over the past seven months, the Purchasing Managers’ index has averaged 56.5, the highest since March 2019. Overall, the report notes, “The manufacturing economy continued its recovery in December. Survey Committee members reported that their companies and suppliers continue to operate in reconfigured factories, but absenteeism, short-term shutdowns to sanitize facilities and difficulties in returning and hiring workers are causing strains that are limiting manufacturing growth potential. However, panel sentiment remains optimistic (three positive comments for every cautious comment), an improvement compared to November.”
Among the key components, the New Orders Index came in at 67.9 percent, up 2.8 percentage points from 65.1 percent in November. The New Orders Index has been above 50 for seven consecutive months and above 60 for six consecutive months. The seven-month average is 63.8, the highest since May 2018. Thirteen of eighteen industries in the survey reported growth in new orders in December.
The New Export Orders Index came in at 57.5 percent in December, down 0.3 percentage points from a 57.8 percent result in November. The Backlog-of-Orders Index came in at 59.1 percent in December, up from 56.9 percent in the prior month and the highest level since June 2018.
The Production Index registered a 64.8 percent result in December, up from 60.8 percent in November. The index has been above 50 for seven consecutive months and above 60 for the last six months. The seven-month average is 61.8, the highest since June 2018. Thirteen industries reported growth in the latest month.
The Employment Index rose in December, adding 3.1 percentage points to 51.5 percent in December, versus 48.4 percent in November. The employment index remains one of the weaker components, posting just two months above the neutral 50 mark over the past 18 months.
The Supplier Deliveries Index, a measure of delivery times from suppliers to manufacturers, jumped to 67.6 percent from 61.7 percent in November. Slower supplier deliveries are usually consistent with stronger manufacturing activity. According to the report, “Suppliers continue to struggle to deliver, with deliveries slowing at a faster rate compared to November. Transportation challenges and challenges in supplier-labor markets are still constraining production growth — and to a greater extent compared to the previous month. The Supplier Deliveries Index reflects the difficulties suppliers continue to experience due to Covid-19 impacts. Supplier labor and transportation constraints are not expected to diminish in the near-to-moderate term due to Covid-19.”
The Prices Index rose to 77.6 percent in December from 65.4 percent in November and the highest reading since May 2018. All 18 industries paid higher prices for raw materials in December.
Customer inventories in December are still considered too low, with the index remaining below 50 at 37.9 percent versus 36.3 percent in the prior month (index results below 50 indicate customers’ inventories are too low). The index has been below 50 for 51 consecutive months. Insufficient inventory may be a positive sign for future production.
Housing Remains A Bright Spot
Homebuilding remains a bright spot for the economy as housing starts and permits posted gains in November while homebuilder sentiment remained strong across the country in December. Total housing starts rose to a 1.547 million annual rate from a 1.528 million pace in October, a 1.2 percent increase. The November gain is the sixth rise in the last seven months since hitting an April low.
The dominant single-family segment, which accounts for more than three-fourths of new home construction, rose 0.4 percent for the month to a rate of 1.186 million. Starts of multifamily structures with five or more units rose 8.0 percent to 352,000. From a year ago, total starts are up 12.8 percent with single-family starts up 27.1 percent and multifamily starts down 16.0 percent.
For housing permits, total permits rose 6.2 percent to 1.639 million in November. Total permits are 8.5 percent above the November 2019 level. Single-family permits were up 1.3 percent at 1.143 million, the highest rate since March 2007. while permits for two- to four-family units fell 3.5 percent to 55,000 and permits for five or more units jumped 22.8 percent to 441,000. Overall, single-family starts and permits are showing persistent strength since the April low while multifamily starts and permits are essentially trending sideways or slightly lower but at a level well above the lows following the 2008-09 recession.
Among the regions in the report, total starts rose in two of the four regions. The South, the largest region by volume, fell 6.0 percent while the Midwest declined by 4.9 percent. However, the Northeast gained 58.8 percent and the West rose 8.2 percent. For the single-family segment, the pattern was similar with the South down 3.1 percent and the Midwest off 9.3 percent while the Northeast gained 5.4 percent and the West rose 12.7 percent.
For housing permits among the regions, total permits rose in all four regions. The Northeast gained 12.9 percent, the South increased 4.7 percent, the West rose 8.3 percent and the Midwest added 3.8 percent. Total housing permits for the South and the West are at the highest levels since the late 2000s. Permits for the Northeast and the Midwest are well above the lows following the 2008-09 recession. For the single-family segment, permits for the Northeast increased 11.7 percent, the South gained 0.8 percent and the West rose 1.1 percent, while the Midwest was unchanged for the month.
The National Association of Home Builders’ Housing Market Index, a measure of homebuilder sentiment, fell to 86 in December, down from 90 in November but still a very strong result. The three-month average, to smooth out monthly volatility, was 87 in December versus 86 in November, a record high. All three components of the index had declines in the latest month but also remained at very high levels. On a regional basis, all four regions had declines in December but on a three-month average basis, three of the four regions have gains; all four regions were at historically high levels.
Single-family home construction activity has recovered sharply since the April low as lockdown restrictions that impacted both construction workers and potential customers were eased. Furthermore, mortgage rates remain near all-time lows, providing support for the recovery though lending standards have tightened amid the policy-induced economic malaise.
Housing is one of the areas that may be experiencing structural change. There appears to be sustained marginal demand for less dense suburban and rural housing as urban dwellers, primarily renters, seek alternative housing. This trend could be boosted if businesses implement permanent work from home policies, to make employees happy but also to cut down on high-cost commercial real estate, especially in high-density, high-cost cities.
Robert Hughes

Robert Hughes joined AIER in 2013 following more than 25 years in economic and financial markets research on Wall Street. Bob was formerly the head of Global Equity Strategy for Brown Brothers Harriman, where he developed equity investment strategy combining top-down macro analysis with bottom-up fundamentals. Prior to BBH, Bob was a Senior Equity Strategist for State Street Global Markets, Senior Economic Strategist with Prudential Equity Group and Senior Economist and Financial Markets Analyst for Citicorp Investment Services. Bob has a MA in economics from Fordham University and a BS in business from Lehigh University.


