Economic Growth Defies Tax Foundation Ranking
 The Tax Foundation, a think tank based in Washington, DC, has published its latest State Business Tax Climate Index. This annual report ranks the 50 states by how business friendly their tax systems are: the higher the score, the better the business tax climate.
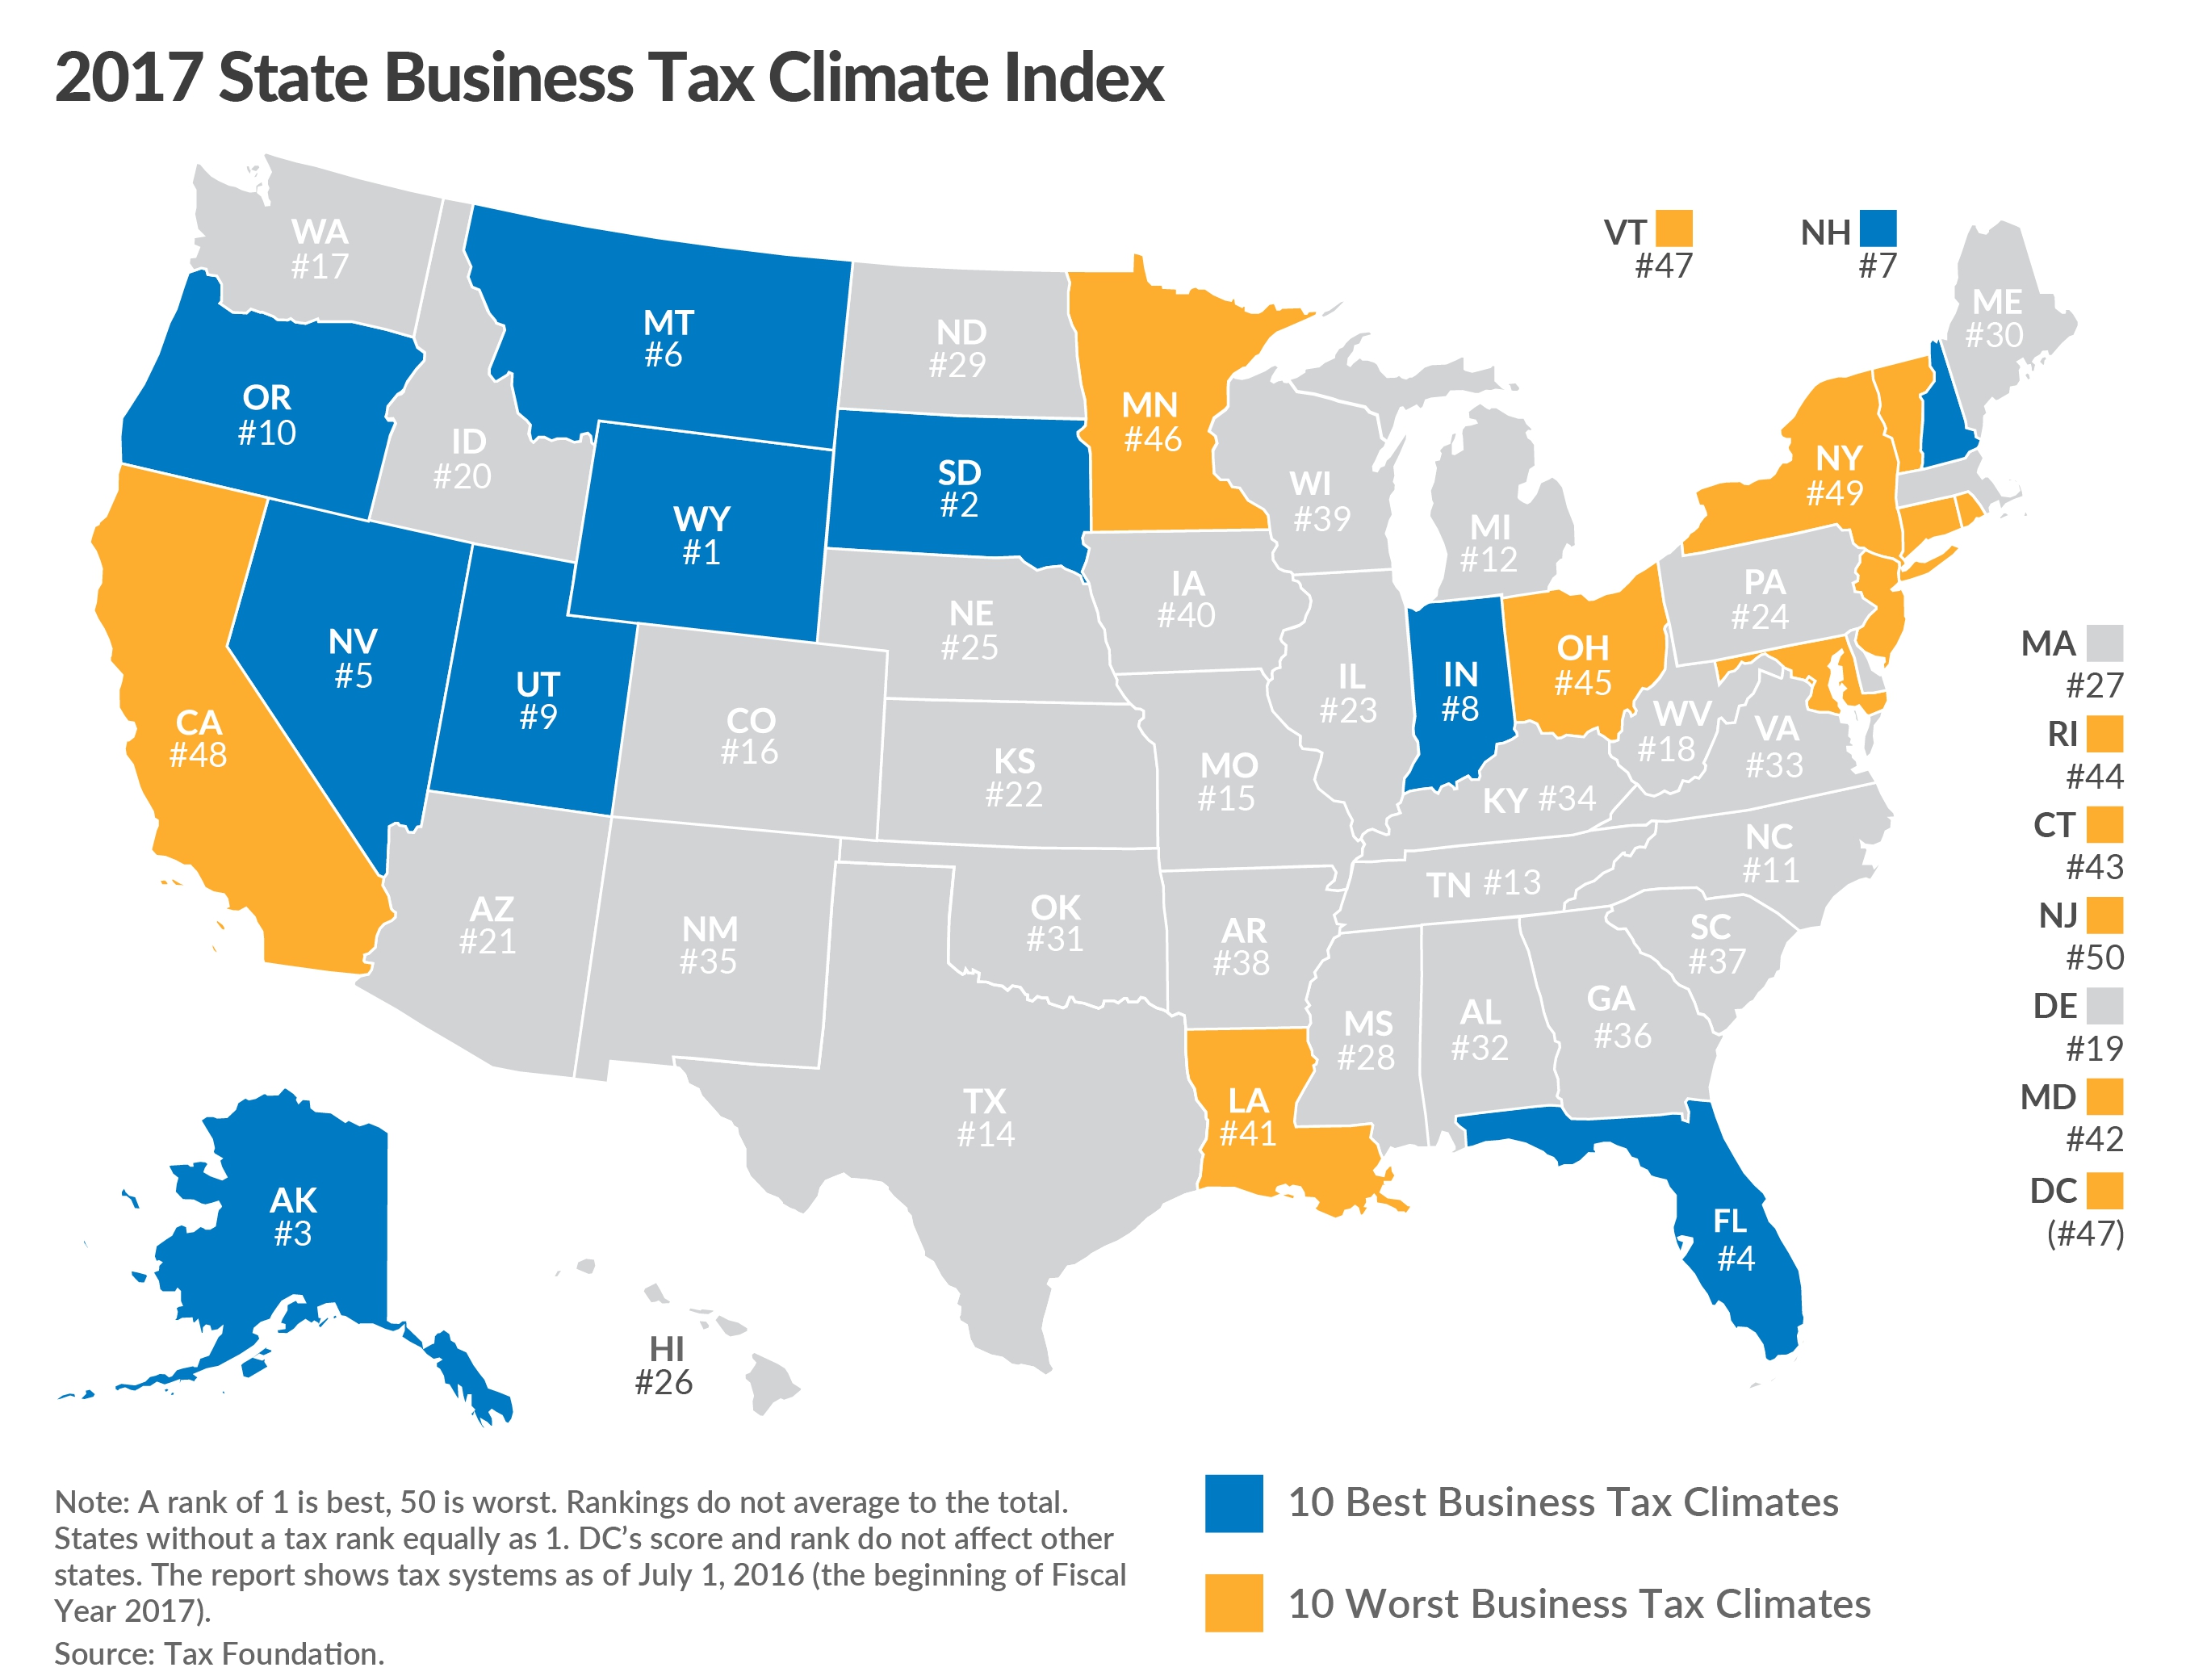
Every year when the index is published, governors and legislators in high-ranking states take the opportunity to make a point of it. For example, in his January 2017 State of the State speech, Wyoming Governor Matt Mead used the report as a reason to explain how well Wyoming was doing.
At the same time, GDP data from the Bureau of Economic Analysis placed Wyoming among the absolutely worst-performing states in the country. Bureau of Labor Statistics numbers showed that Wyoming was bleeding private-sector jobs.
Is this an anomaly? Is Wyoming a notable exception from the rule that high-ranked states have fast-growing economies?
Unfortunately, no. There is no macroeconomic data to show that a “good” business-tax index score is associated with a strong state economy. On the contrary, a review of state GDP data indicates that the opposite might actually be true. Contrary to conventional wisdom, the relationship between taxes and economic growth is not very straightforward. On the one hand, tax cuts do benefit economic activity – there is little controversy on that point – but on the other hand, some taxes are more harmful to economic activity than others.
This is an important conclusion for politicians seeking to improve the economy through tax reforms. It is also important for business executives deciding where to make their investments. Both existing taxes and expected tax reforms play an important role in business outlooks on costs of operations, market growth, and ability to attract workers.
Problems with the Business Tax Climate Index
To see why the Tax Foundation’s Business Tax Climate Index is too simplistic a source of information, consider the data presented in Figure 1. It compares the business-tax index scores from 2012 and 2013 with the GDP growth numbers from the states in the same years. If there were any obvious benefits from a “good” tax-index score, they should be visible here. A total of 100 data pairs, from 50 states over two years, are sorted from the one with the highest tax-index score to the lowest:
Figure 1
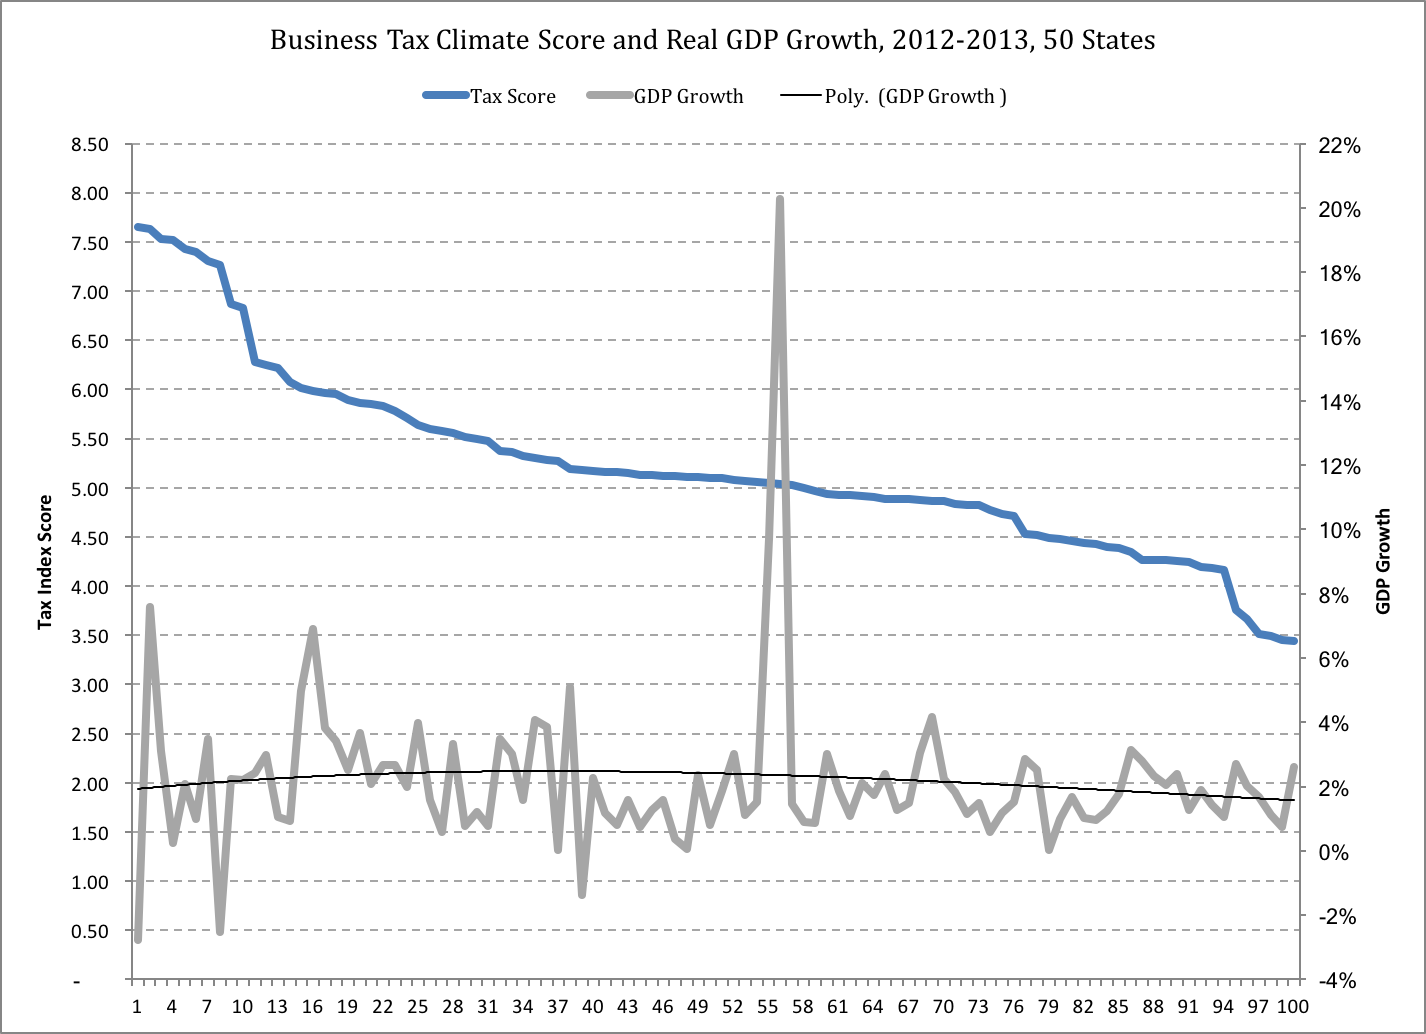
Sources: Tax Foundation (index score), Bureau of Economic Analysis (state GDP).
There is absolutely no correlation between the Tax Foundation’s tax-index score and a state’s economic performance.
The same data for 2017 tells an even more compelling story. A concentration on private-sector GDP, which rules out growth driven by government spending, actually hints at a negative correlation between the business-tax index and economic growth. The 10 states that have the highest tax-index scores had an average of 1.3 percent annual private-sector growth in the first quarter of 2017 (see list of states below figure). By contrast, the 10 states that score the lowest on the tax index averaged 1.9 percent private-sector GDP growth:
Figure 2
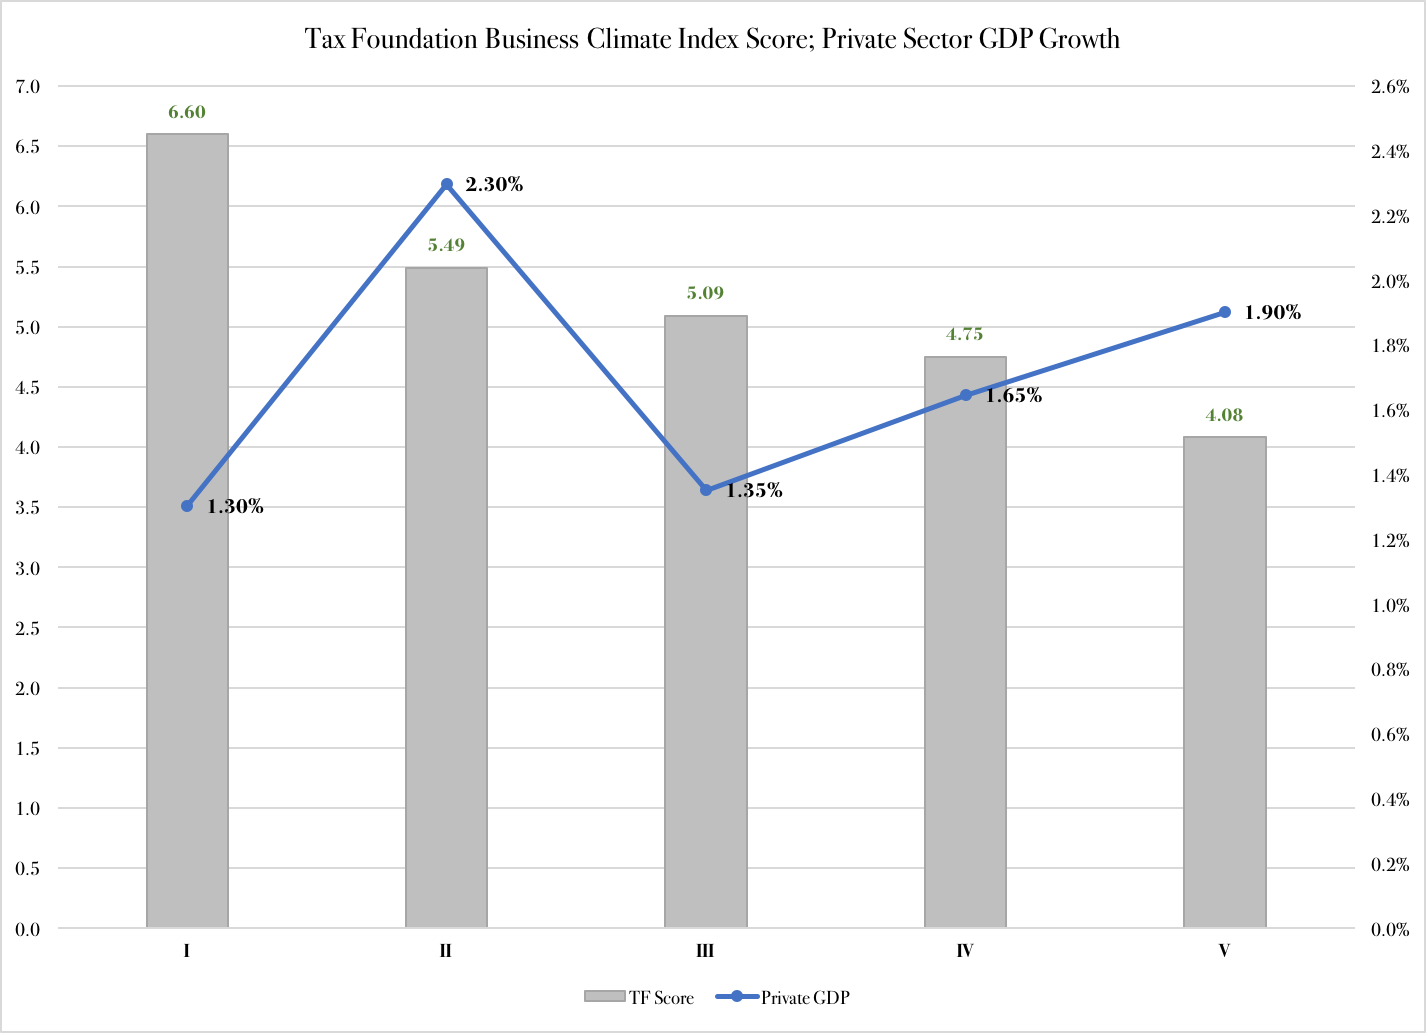
Sources: Tax Foundation (index score), Bureau of Economic Analysis (state GDP)
Table 1
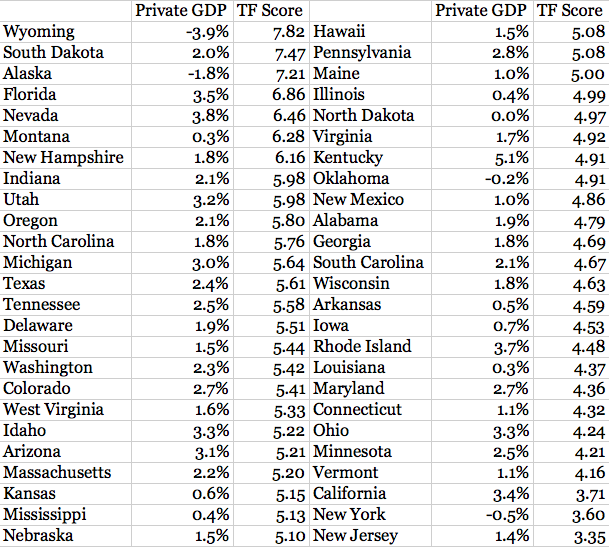
Growth in private-sector GDP is uneven among the several states:
- Ranked at the top are Kentucky with 5.1 percent, Nevada with 3.8 percent, and Rhode Island with 3.7 percent.
- At the bottom are New York (-0.5 percent), Alaska (-1.8), and Wyoming (-3.9).
High Taxes or Wrong Taxes?
It is, therefore, not appropriate to draw the conclusion that a poor business-tax climate is good for a state’s economy. In fact, Figures 1 and 2, as well as Table 1, present friends of limited government and free markets with a compelling question: is there really anything wrong with high taxes?
Some will gladly say “no.” In January, the Center on Budget and Policy Priorities and the National Conference of State Legislatures co-produced a presentation where they firmly suggested that tax cuts could be bad for states’ economies. While not stating outright that high taxes are good for economic growth, the CBPP and NCSL challenged the notion that lower taxes would help.
At the same time, there is compelling literature that speaks in favor of tax cuts. Among the foremost in demonstrating this is Dan Mitchell, former senior fellow at the Cato Institute (and before that a fellow with the Heritage Foundation). Mitchell, one of the world’s foremost experts on tax policy, has repeatedly demonstrated that tax cuts significantly stimulate economic growth. In a 2003 paper for the Heritage Foundation, he made a historic resume of tax cuts and economic growth in the United States, concluding that:
There is a distinct pattern throughout American history: When tax rates are reduced, the economy’s growth rate improves and living standards increase.… History tells us that tax revenues grow and “rich” taxpayers pay more tax when marginal tax rates are slashed. This means lower income citizens bear a lower share of the tax burden — a consequence that should lead class-warfare politicians to support lower tax rates. Conversely, periods of higher tax rates are associated with sub-par economic performance and stagnant tax revenues. In other words, when politicians attempt to “soak the rich,” the rest of us take a bath.
In a 2012 piece for Forbes Magazine, Mitchell reinforced his point by explaining how the Laffer Curve is not just a theoretical construct, but a fact of life.
But if the Laffer Curve works, how do we explain the statistical facts put forward in Figures 1 and 2 and Table 1?
To begin with, it is worth noting that the two critics of lower taxes as a growth generator rely on specific premises to make their cases. The CBPP/NCSL report takes a static approach to the economy. The analysis begins with the premise that a $1 cut to government spending has the same negative effect on the economy as the positive effect from a $1 tax cut. The reduction in government spending, they say, takes away the paychecks of government employees, and otherwise reduces the amount of money government puts into the economy. Therefore, the story goes, it makes no difference to cut taxes, because there always has to be a dollar-for-dollar, simultaneous cut in government spending.
Aside the fact that this argument is static and rules out growth effects of tax cuts, it also makes the implicit assumption that government is as efficient at using our resources as the private sector. This is not the case. Without exploring the literature at length, it is worth referring to one of the most intriguing studies of government inefficiency ever published. It is a working paper from the European Central Bank in 2003, where three economists impressively estimate the loss in output efficiency in government. Their conclusion is clear: the higher taxes are, and the bigger government grows, the more inefficient government gets.
So, if lower taxes do benefit private-sector economic activity, then why don’t the Tax Foundation’s Business Tax Climate Index correlate with positive effects on economic activity?
The explanation might be in the Foundation’s own research. In a 2012 literature review, the Foundation’s William McBride found that:
The consensus among experts is that taxes on corporate and personal income are particularly harmful to economic growth, with consumption and property taxes less so. This is because economic growth ultimately comes from production, innovation, and risk-taking.
Without getting too technical, the point McBride makes is this: you cannot simply assume that personal and corporate income play the same role in every state. In some states, personal income will be more important to the economy than in other states.
Data from the Bureau of Economic Analysis confirms this: when personal income is compared to state GDP, substantial differences emerge. In Delaware, for example, personal income is only equal to 65 percent of GDP; by contrast, in Vermont and Florida, it exceeds 100 percent of state GDP.* For this reason, the presence or absence of a tax on personal income makes a bigger difference in Florida than in, say, Delaware. The income-tax variable should therefore weigh more heavily in Florida than it does in Delaware.
Figure 3 compares existing income-tax scores in the Tax Foundation’s Business Tax Climate study, with scores adjusted for state-level differences in the role of personal income.
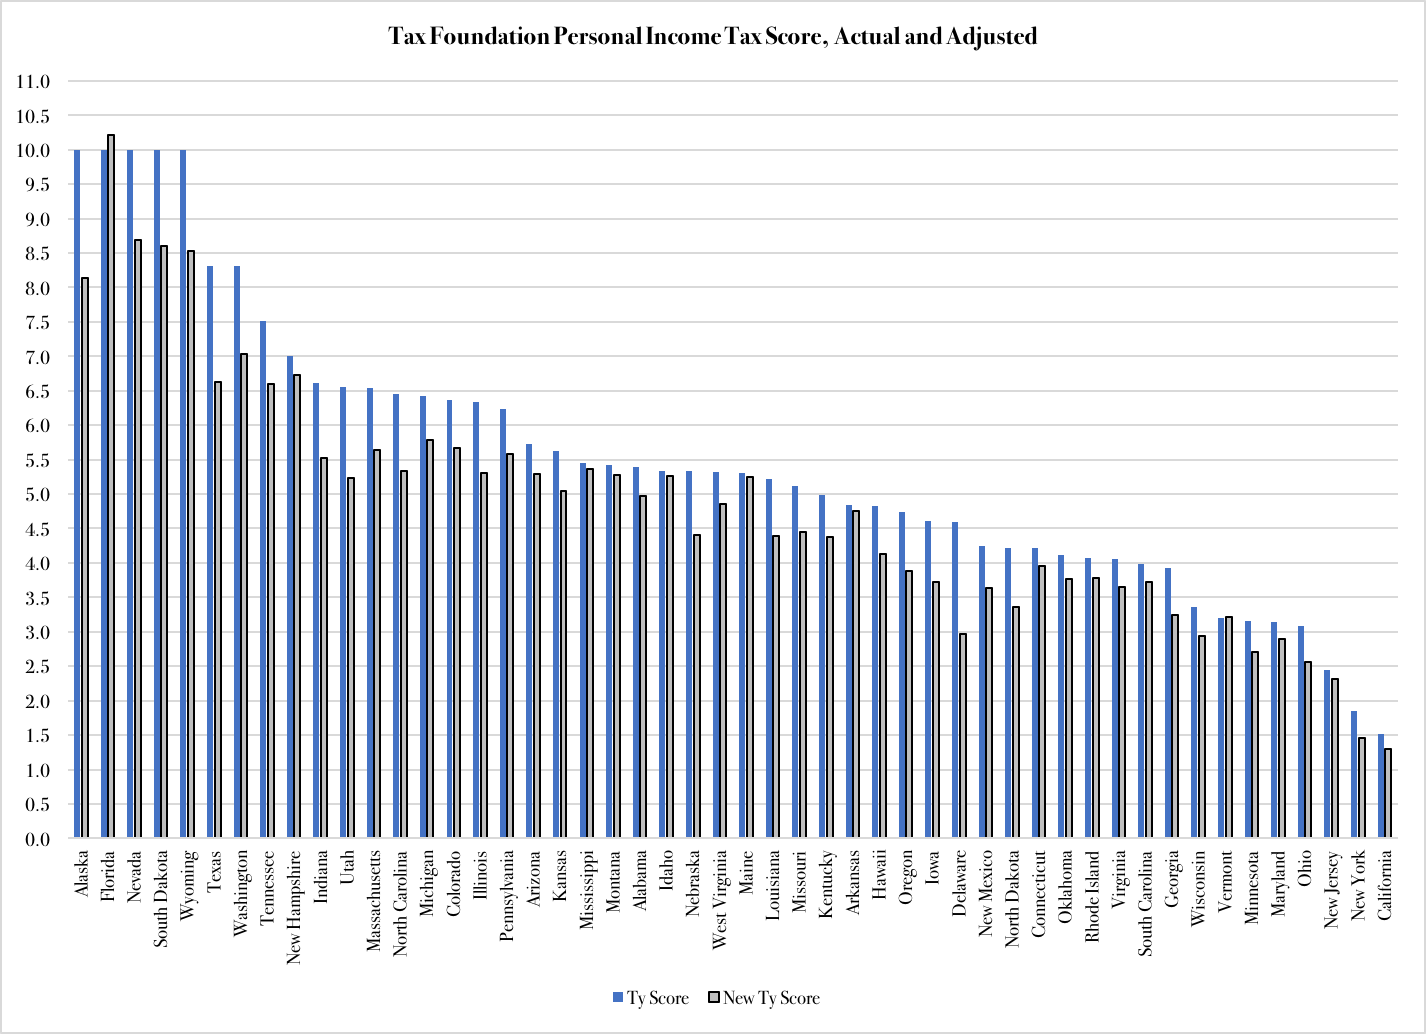
Sources: Tax Foundation (index score), Bureau of Economic Analysis (personal income)
It remains to be seen if these adjustments would improve the usefulness of the Tax Foundation’s tax-climate index. Until some changes are made, the index remains a cause for debate, and it should be handled with care in the tax-policy debate in general.
*Macroeconomics textbooks say that no economic activity should exceed GDP. This is true, but only to a point. National accounts do not include so-called financial transactions. In other words, payments for which there is no reciprocal transaction of a good or service. For example, Social Security payments are not counted as income in the national accounts. Therefore, when personal income is expanded to include entitlements, such as Social Security, the sum total of personal income can in fact exceed GDP.
Image: Tax Foundation.