Don’t Trust Inequality Data: A Lesson from the UK
The best-known recent scholarship on economic inequality focuses heavily on the United States, positing an upward trend in top income and wealth concentrations that started around 1980. There are numerous reasons to doubt the accuracy of the data purporting to illustrate this trend. The timing of this claimed rebound nonetheless remains the central feature of most policy prescriptions to address inequality itself.
The basic story asserts that tax cuts by the Reagan administration in the early 1980s spawned the alleged rebound, and therefore steeply progressive tax increases are needed to reverse the course. While this story is U.S.-specific, the same causal mechanism should theoretically hold in other developed economies — if indeed it is true.
As a point of comparison, we just so happen to have another parallel example in the United Kingdom. Conservative leader Margaret Thatcher took office in 1979 at a time when the top marginal income tax rate sat at a historical maximum that exceeded 90 percent. Between 1979 and 1988, Thatcher shepherded through a series of tax reforms that eventually reduced the top marginal rate to just 40 percent.
While the two countries diverge in other areas of tax policy, the timing and direction made Thatcher’s income tax reforms nearly contemporaneous to the Reagan tax cuts in the United States. So how did these tax cuts affect inequality in the United Kingdom?
Picking Up From Piketty
As with the U.S., the current debate around inequality in the U.K. owes a debt to French economist Thomas Piketty.
Piketty’s book Capital in the 21st Century first drew widespread attention to the theory that tax cuts spawned an inequality boom in the United States. Unsurprisingly given their parallel income tax rate evolutions, his examination of the United Kingdom reached an almost-identical conclusion. Inequality in the U.K., he claimed, was on the rebound since 1980, and Thatcher’s tax policies were to blame.
Furthermore, he contends, the 1980s cuts to the top income tax rates reversed a century-long pattern towards greater equality. As he writes in Capital,
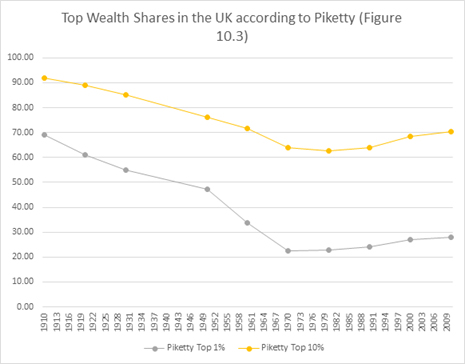
In Britain, the upper decile’s [wealth] share fell from more than 90 percent on the eve of World War I to 60-65 percent in the 1970s; it is currently around 70 percent. The top centile’s share collapsed in the wake of the twentieth century’s shocks, falling from nearly 70 percent in 1910-1920 to barely more than 20 percent in 1970-1980, then rising to 25-30 percent today.
The decline then rise of inequality found in the U.K., Piketty further contended, was part of a “general phenomenon” that illustrated the responsiveness of wealth concentration to steeply progressive tax policies of the same type that he personally favors. In short, the British experience confirmed his theory about the United States and indeed most developed economies around the world. The progressive Left’s favored prescription of a global wealth tax accordingly became a primary tool to reverse the trend.
U.K. Inequality Reassessed
Piketty presented an array of data purporting to prove this pattern, including a visually appealing chart that showed the visible dip and rebound in top wealth concentrations. The applicable portions of that chart may be seen below, with a U-shaped pattern appearing in the 1980s.
After the publication of Piketty’s book in 2014, several of his charts and statistical claims began to attract closer scrutiny. The Financial Times published a lengthy criticism of Piketty’s data (which he partially rebutted in an online rejoinder). I also published a replication study of Piketty’s U.S. statistics with Bob Murphy, showing that Piketty’s data construction tended to accentuate the American U-curve by pivoting between disparate data sources. Subsequent works by other scholars have confirmed as much, prompting additional scrutiny around his narrative for the United States.
Aside from the initial Financial Times study, Piketty’s U.K. data received very little additional discussion, and his narrative — pinning a claimed inequality rebound on Thatcherism — has since been widely embraced.
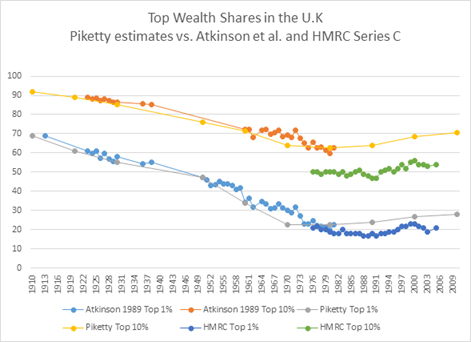
There’s a problem with Piketty’s U.K. data, however. His graph, as depicted above, looks almost nothing like the source statistics he used to construct it. To see what was going on I conducted another replication analysis, the results of which were recently published in Social Science Quarterly.
My chart comparing Piketty’s estimates against his source statistics may be seen below.

Unfortunately, it is not possible to accurately reconstruct Piketty’s charts from the tables he provided, but a common theme appears when they are compared to the actual statistics. Piketty appears to have adjusted his series upward at the exact moment the Thatcher tax reforms took effect.
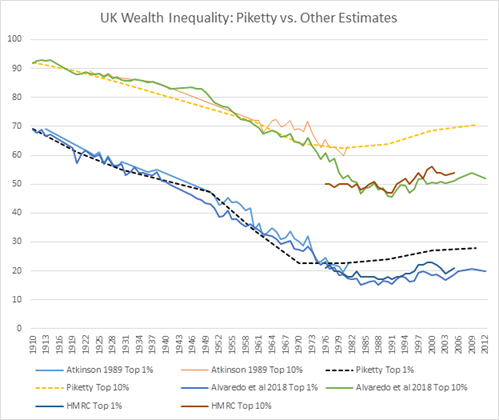
Additional work has been done on the U.K.’s wealth concentration since Piketty’s book came out, including a 2018 study (Alvaredo et al. 2018) by a group of authors who are politically sympathetic to Piketty’s larger project. Their results also diverge from his narrative, as may be seen in the chart below, where they are overlaid with the same raw statistics that Piketty claims to have used.
As can be seen in this comparison as well, the inequality rebound from Piketty’s chart is not at all apparent in any of the source data. Rather, it flattens out around the start of Thatcher’s term and, subject to a few small fluctuations in between that mostly post-date her government, remains on par with its 1980 level today.
Recall that Piketty specifically attributed an inequality spike of about 5 to 10 percentage points for the top wealth decile and centile between 1980 and the present. His charts depict as much, yet the actual measures I considered in my analysis show something very different. Wealth concentration in the U.K. barely moved over this period.
From 1980 to 2012 (the most recent available year), the top 1 percent wealth share only added 1.13 percentage points, not the 5.3 that Piketty claimed. The top 10 percent in 2012 sat almost exactly at its 1980 level, even though Piketty’s chart claimed a 7.9 point rise.
The cause of the sharp divergence between the Piketty numbers and reality may never be fully known as he did not publish his original calculations. They do clearly skew in the direction of increasing inequality though, and in a way that is very convenient to his political narrative about the effects of the Thatcher tax reforms.
Inequality will likely continue to dominate political discussions for many years to come, particularly as progressive causes and candidates on both sides of the Atlantic point to it as a social ill. Yet as the U.K. example illustrates, a popular narrative about evolution of income concentration in the last three decades is actually built upon deeply flawed empirical work that seems to prop up a favored tax-hike prescription.
The zeal for a higher and more progressive tax structure is strong in many corners of the inequality literature. Allowing that zeal to distort our statistical measures of wealth concentration is not only poor social science, but a political corruption of empirical analysis to the service of a prescriptive end.


