Did State Reopenings (and Closings) Have Little Effect on Spending?


An innovative new study by economists Raj Chetty, Nathaniel Hendren and Michael Stepner of Harvard University, and John N. Friedman from Brown, asks “How Did COVID-19 Stabilization Policies Affect Spending and Employment?” They deploy microdata from Harvard’s Opportunity Insights team, partly funded by the Gates Foundation and the Chan-Zuckerberg Initiative. Affinity Solutions credit card data is used to estimate local changes in several categories of consumer spending. Data culled from Earnin and Homebase apps is used to estimate changes in low-income employment and wages by zip code.
This is arduous, outstanding research with many important uses. Yet when it comes to assessing the economic impact of pandemic-related business closures and stay-at-home (SAH) orders, the Chetty-led team uses weak short-term evidence from an early sample of states to draw these strong conclusions:
“Because the root cause of the shock appears to be self-isolation driven by health concerns,” they argue, “there is limited capacity to restore economic activity without addressing the virus itself. In particular, we find that state-ordered reopenings of economies have only modest impacts on economic activity.” They write, “Spending and [low-wage] employment remained well below baseline levels even after reopenings, and in particular did not rise more rapidly in states that reopened earlier relative to comparable states that reopened later.”
There is no doubt that fear of being infected reduced the number of people engaged in many close person-to-person activities, from movie theaters to cruise ships. But that does not mean self-isolation would have stopped most people from getting haircuts, shopping in small stores, visiting relatives, attending weddings, or having dinner in restaurants. If that were true, governors and mayors would not have bothered to prohibit such activities.
There is likewise no doubt that “addressing the virus” would greatly invigorate the economy if “addressing” means mass vaccinations. But there is considerable doubt that SAH orders and/or business closures successfully slowed infections for long, much less restored economic activity while in effect (i.e., without reopening). If lockdowns had really “addressed” the virus, then governors in states like California and New York would have had no reason to repeatedly reimpose restrictions on economic activity soon after previous restrictions failed to address the virus.
Aside from data problems behind these myopic assertions of “little immediate impact,” the notion that self-isolation alone caused the downturn and that neither lockdowns nor reopening had much effect seems far-fetched. If voluntary self-isolation explained why restaurants, gyms, and hair salons lost customers during lockdowns, why did such businesses have many more customers after reopening than they did before? If nothing can be done to restore economic activity without “addressing the virus,” then why did economic activity grow so vigorously for nearly eight months since virtually all states greatly reopened their economies?
There are conceptual, dating and measurement problems with this Harvard team’s data that led the study’s authors to assert that state-ordered reopenings by May 4 (and presumably also closings) had “modest impacts on economic activity.”
To prove “modest impacts” of reopening, the Chetty study mainly relied on evidence for total consumer spending (rather than spending in sectors that were reopened) over the first two weeks after reopening orders “in the 20 states [actually 23] that issued such orders on or before May 4.” They compared those two-week changes with “a group of control states selected from a group of 13 states that did not issue reopening orders until after May 18.”
They single out just one example, finding “there is no evidence that the earlier [May 1] reopening in Colorado did anything to boost spending during the intervening weeks before New Mexico reopened [May 16].”
The time between May 1 and May 16 is much too short to make credible comparisons. Even if Colorado rules had changed much on May 1, most affected businesses could not possibly restock, rehire, and reopen within a week or two, so sales would have remained low. Most restaurants would not yet have new food or staff and most stores would not yet have new goods to sell. Besides, the dates are wrong. On April 27 – not May 1– Colorado began reopening offices at 50% capacity; not dentistry and hair salons but rather only curbside delivery at retail stores. The only change on May 1 was that restaurants could then be reopened but only for takeout. Neither Colorado stores nor restaurants were reopened May 1.
The states chosen for these brief April-May comparisons also do not inspire confidence. Minnesota is oddly included among states that reopened first, on April 27, although the state’s SAH order was not lifted until May 18. South Dakota, which never issued any SAH order or closed any businesses, is somehow counted among those that supposedly locked down until May 18.
There are two different control groups for each of five early reopening dates, adding up to ten. One group is based on Affinity credit card data for consumer spending, and the other uses Earnin app data to count only low-income jobs. South Dakota is in both Affinity and Earnin groups selected six times to exemplify states allegedly late to reopen. Yet no state has been more open for more time than South Dakota, which even reopened schools (the only thing ever closed) by April 28.
New Hampshire is another control state selected eight times out of ten, ostensibly “by choosing by nearest-neighbor matches.” Is New Hampshire nearest to such reopening states as Texas, Georgia, Oklahoma, and Florida? Several control states are also unusually small, with New Hampshire or Vermont accounting for only 0.2% of U.S. GDP in 2019, and South Dakota for 0.4%.
The Chetty study’s emphasis on total consumer spending is also a misleading gauge of the “impact on the economy” (meaning people) of Covid-19 restrictions. Prohibiting people from spending on some things can result in spending more on other things (e.g., cars and home furnishings). In fact, the biggest problem for owners and employees of closed retail stores was that consumers shifted to online shopping or big box stores, relocating consumer spending rather than shrinking it. Best Buy was closed so COSTCO and WalMart sold more TVs and computers.
Consumer spending also excludes a lot of closed firms and their employees, because many closed businesses did not sell directly to domestic consumers. Many closed service and manufacturing firms are totally overlooked in consumer spending data because they did business with other businesses, at home and abroad, not with consumers.
In short, the Chetty study’s cross-section comparisons use wrong dates, wrong states, and an extremely short and early period of time to examine only two imprecise gauges of economic lockdowns – broad consumer spending and narrow (low-wage) employment.
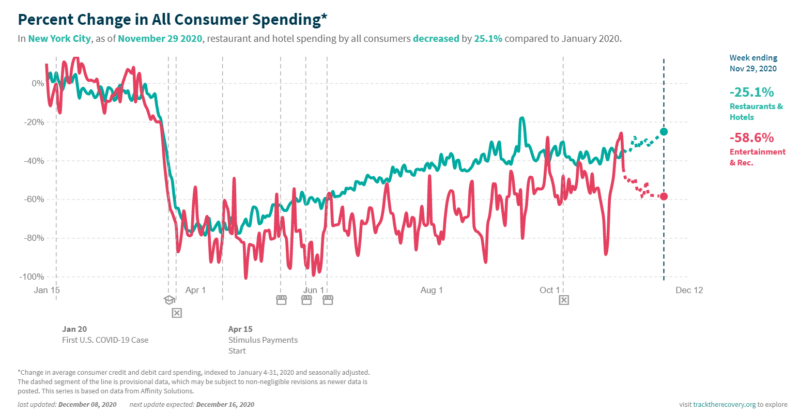
Fortunately, downloadable time series graphs from the same Opportunity Insights database provide more detail about what happened over a long period of time in key states after they either closed or reopened. The first such graph is about New York City, showing “Percent Changes in [All] Consumer Spending.” It highlights “restaurants and hotels” and “entertainment and recreation” because these activities are clearly and deeply affected by SAH orders, business closures and travel restrictions.
These graphs depict a graduation cap on the timeline to indicate schools being closed. Boxes marked with an X indicate new statewide Covid restrictions. Boxes with a roof of circles indicate partial reopenings (in other parts of New York State). Because hotels are bundled in with restaurants that series has improved to being down “only” 25% since January thanks to other states reopening which revived some travel into the Big Apple.
As for entertainment, we do not need a graph to be saddened that closing Broadway shows, the Met, Radio City Music Hall, Lincoln Center and Carnegie Hall ruined the lives of their skilled performers and destroyed a wondrous tourist attraction. We also do not need proof that restricting restaurant dining to outdoors only, then 25% indoors and now zero in or out has murdered many fine NYC restaurants. As this data gets updated, the red line will fall even deeper into the red.
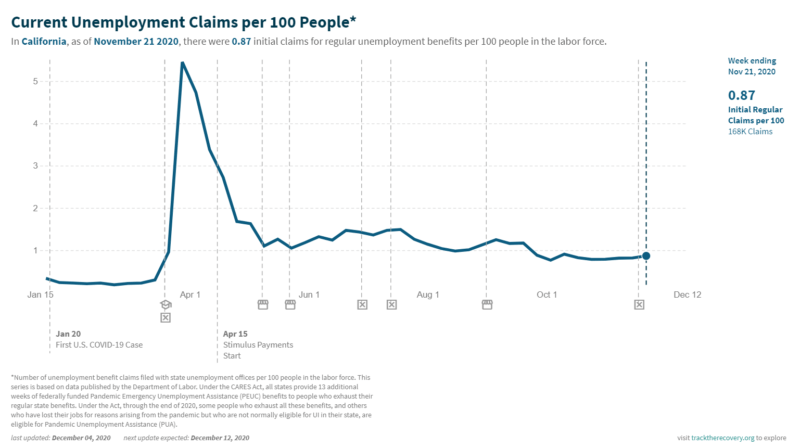
The second graph is about California and may help visualize the impact of closing, opening, reclosing and reopening state businesses. It shows “Current Claims to Unemployment Benefits per 100 People.”
The nation’s first lockdown on March 17-19 closed all but the most essential California businesses (e.g., WalMart, Costco, Target, and liquor stores). It also closed supposedly dispensable health and dental services as well as hair salons, gyms, etc. Governor Newsom instructed everyone unhappy with those choices to stay home and shop on Amazon. Jobless claims quickly rose five-fold, as “stay-at-home” intended.
A rare glimmer of hope began to arrive in California with the May 8 and May 22 partial reopening of some politically selected counties and businesses, quickly followed by reclosings on June 28 and July 13. Several weeks later there was another brief and limited county-by-county reopening on August 31. By October, frequent waves of business losses and uncertainty left California with an unemployment rate of 9.3% – nearly as high at 9.6% in New York (which included 13.2% in New York City and 17.5% in the Bronx).
Alas, California once again began more county-by-county reclosings on November 13. October’s unemployment rate of 9.3% will soon seem like the good old days. Since early December, creeping county restrictions have escalated into stay-at-home orders and extensive business closure over Northern and Southern California, encompassing at least 36 of the state’s 58 counties and nearly 85% of state population.
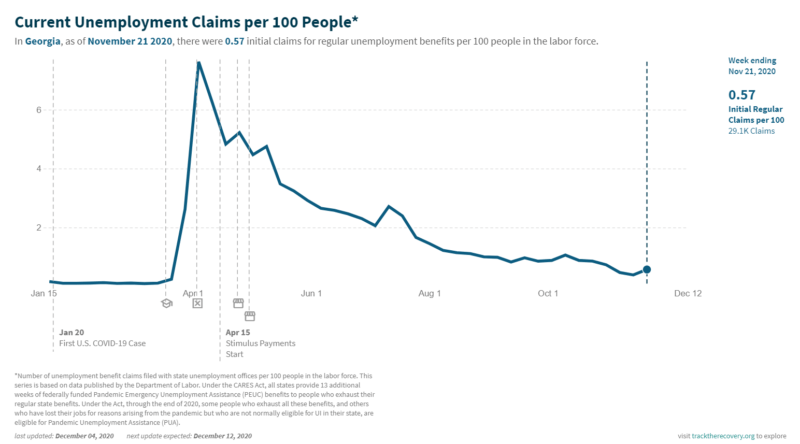
Another graph lets us compare California’s habitual lockdowns and chronic high unemployment with constant job market and income gains in Georgia – a state that reopened quickly and never reclosed. By October Georgia’s unemployment rate was only 4.5% – almost as low as in South Carolina (4.2%) which was the first to reopen on April 20.
The Chetty study’s claim that reopenings had little effect implies that closings must likewise have little effect, because everyone faced with stay-at-home orders would supposedly have self-isolated anyway.
This hypothesis is about to be harshly tested in nine states: California, Washington, Oregon, Illinois, Michigan, New Mexico, Kentucky, Hawaii and Rhode Island. These states have issued mandatory business closings that effectively closed “most businesses,” according to The New York Times. Together the ten states accounted for 29.2% of U.S. GDP in 2019, with half of that (14.7%) from California. In addition, Ohio and North Carolina, accounting for 5.9% of GDP, imposed highly restrictive stay-at-home orders (as did California).
Assuming these state restrictions on businesses and households continue into January, Democratic governors of these exceptionally stringent ten states are making it extremely challenging for President Biden in January, who will be taking office with more than a third of the nation’s economy deliberately crippled. These states face the self-inflicted pain of growing unemployment, business failures and loan defaults.
Vaccines alone cannot thaw frozen state economies unless and until they in some way encourage governors to reopen. If any lockdown-prone governors do reconsider their orders, there is a distinguished team of Ivy League economists who stand ready to advise that reopening closed economies could make little “immediate” difference. That would be terrible advice.
Alan Reynolds

Economist Alan Reynolds is a senior fellow at the Cato Institute, and former vice president of the First National Bank of Chicago. He served as research director with Jack Kemp’s 1995-96 Tax Reform Commission, and with Larry Kudlow and Alan Greenspan as a member of President Reagan’s 1981 transition team. He is a former columnist with Forbes, Reason, and Creators Syndicate. He is also a past member of the Blue Chip and Wall Street Journal forecasters.
Author of the 2006 book Income and Wealth, Alan Reynolds has written for countless publications since 1971, including the Wall Street Journal, New York Times, Harvard Business Review, The Public Interest, National Review, Regulation and The Cato Journal.