December Business Conditions Monthly

AIER’s Leading Indicators index inches higher while the Roughly Coincident index and Lagging index fall.
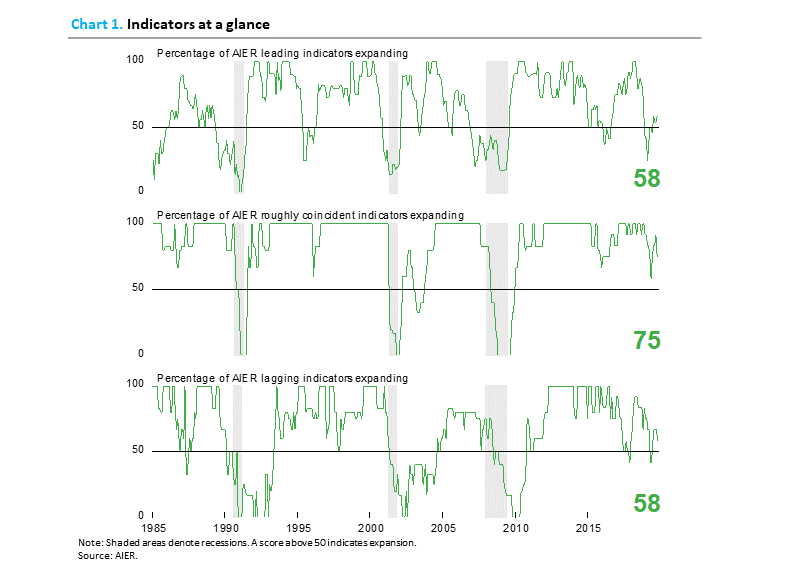
AIER’s Business Cycle Conditions Leading Indicators index increased slightly in November, remaining modestly above neutral at 58. The Roughly Coincident Indicators index fell 17 points to 75 from 92 while the Lagging Indicators index fell nine points to 58 after posting 67 for three consecutive months (see chart).
The always-important holiday spending season is well underway and while early indications are for a strong selling period, the early indicators are not always indicative of the final results. Nevertheless, positive early signs are a welcome development given the importance of consumers to the economy, and holiday sales to most businesses. Other areas of the economy continue to post mixed results, suggesting the economy remains heavily dependent on consumer spending and therefore more vulnerable than usual to the whims of consumers.
Politics (impeachment proceedings and upcoming elections) and policy (trade policy, monetary policy, immigration policy and fiscal policy) have the potential to undermine consumer and business confidence. Overall, the economy continues to expand but at a slow pace and remains vulnerable to continued erratic policies and extreme partisanship.
Leading indicators index rises slightly in November
The AIER Leading Indicators index posted a small gain in November but remains close to neutral, supporting a cautious outlook.
The AIER Leading Indicators index rose 4 points to 58 in November. The index has been range bound between 25 and 75 for 12 consecutive months. The extended period of close-to-neutral results are consistent with the overall mixed performance of the various sectors of the economy. The general message is continued economic expansion albeit at a slow(ing?) pace and with a heightened degree of uncertainty.
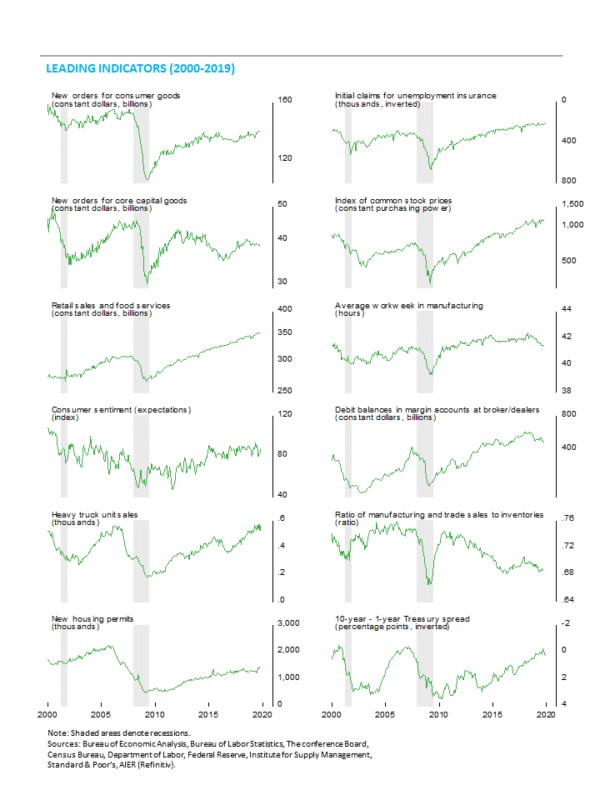
The small change in the Leading Indicators Index was the result of just one change among the 12 indicators. Initial claims for unemployment insurance improved from a neutral trend in the previous month to a positive trend in the latest month. This indicator had been in a favorable trend prior to the drop to neutral. As discussed last month, initial claims for unemployment insurance is a bound indicator, meaning it cannot go below zero and in practical terms is about as low as can be expected. Therefore, it’s not surprising to see the indicator move to a flat trend. The improvement to a favorable trend in the most recent month helped boost the overall leading indicators index but as initial claims fluctuate near its natural lower bound, the indicator is likely to flip-flop between favorable and neutral. A move to an unfavorable trend would be a more significant development.
Among the 12 indicators, seven indicators had positive trends in November with 5 trending lower and none registering a neutral result. In addition to initial claims, positive trends were seen in real retail sales and food services, real new orders for consumer goods, housing permits, total heavy-truck unit sales, real stock prices, and the 10-year–1-year Treasury yield spread.
Unfavorable trends were seen in debit balances in customers’ margin accounts, new orders for core capital goods, the ratio of manufacturing and trade sales to inventory, the University of Michigan index of consumer expectations, and the average workweek in manufacturing.
Overall, the Leading Indicators index remains modestly above 50, indicating continued expansion is likely. However, the fluctuation around the neutral level over the past 12 months combined with the other mixed economic data and erratic policy suggest a high degree of caution remains warranted.
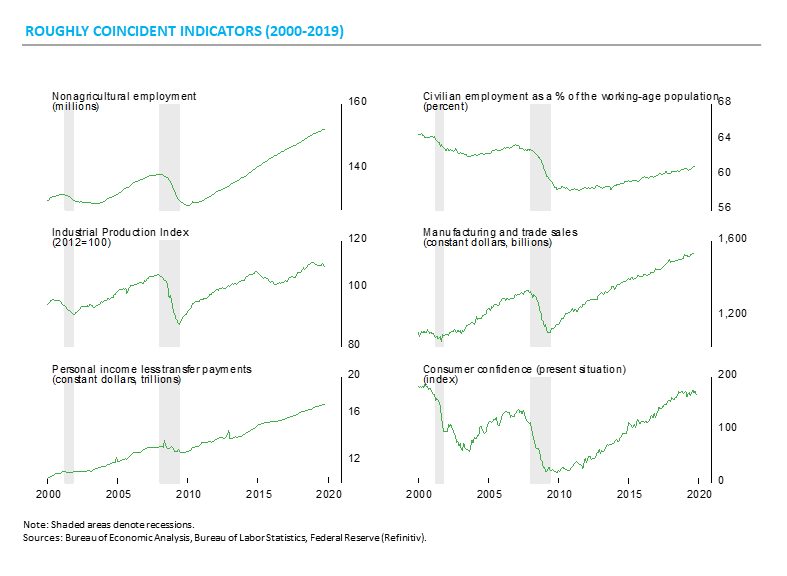
The roughly coincident indicators index fell to 75 in November from 92 in October. As expected, the industrial production indicator, which had improved from a negative trend to a neutral trend in the prior month, returned to a negative trend in the latest month. Manufacturing-related data continue to suggest a very difficult environment for the sector. In addition to the industrial production indicator, the consumer confidence indicator weakened from a positive trend to a neutral trend in the latest month. As discussed above, consumer spending remains a critical source of growth. Deterioration in consumer confidence is a worrying development. Overall, there were four roughly coincident indicators trending higher in November, one trending lower, and one neutral.
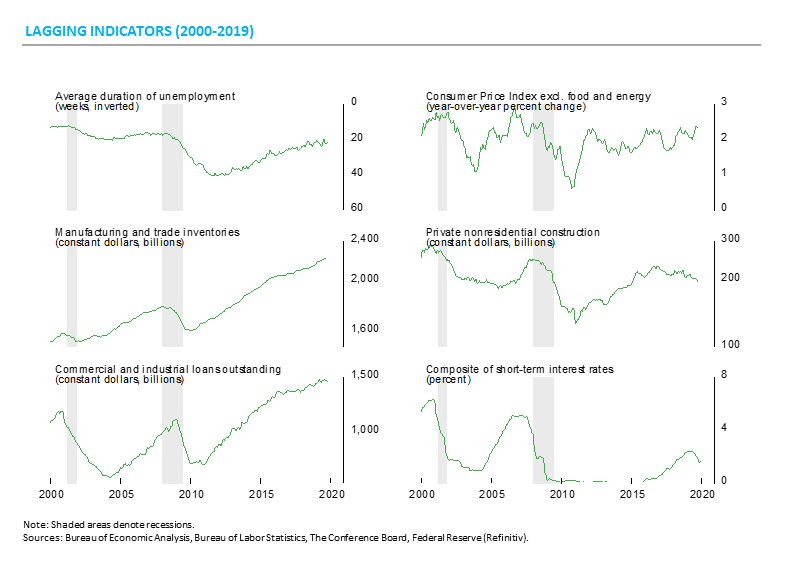
AIER’s Lagging Indicators index also declined in the latest month, dropping to 58 following three consecutive months at 67. The November result was the lowest reading since July. Among the six lagging indicators, three indicators are trending higher, two are trending lower, and one was neutral.
Consumer spending increasing but the pace is erratic
Following a moderate gain in the third quarter, early indicators for fourth-quarter consumer spending are mixed
The revised estimates for third-quarter real gross domestic product shows output rose at a 2.1 percent annualized pace versus a 2.0 percent pace in the second quarter. Consumer spending decelerated in the third quarter, rising at a moderate 2.9 percent pace compared to a 4.6 percent growth rate in the second quarter. The deceleration was broad-based across the major segments of consumer spending, with durable-goods spending rising 8.3 percent versus 13.0 percent in the second quarter, nondurable-goods spending up 4.3 percent versus 6.5 percent, and services gaining 1.7 percent versus 2.8 percent. Consumer spending contributed 2.0 percentage points to the 1.9 percent real GDP growth rate versus 3.0 percentage points in the second quarter.
October retail sales rise modestly…
The fourth quarter may have gotten off to a moderate start as retail sales and food services spending rose 0.3 percent in October following a 0.3 percent decline in September. Over the past year, total retail sales and food services were up 3.1 percent through October, the slowest pace since February.
Excluding the volatile auto and energy categories, core retail sales and food services were up 0.1 percent in October after a fall of 0.1 percent in September. Core retail sales had posted six straight monthly gains through August before declining in September. Over the last three months, core retail sales are up at just a 1.5 percent annualized rate, the slowest since February.
…though light-vehicle sales for first two months trail the third quarter…
Sales of light vehicles totaled 17.21 million at an annual rate in November, up from a 16.5 million pace in October. For the second quarter, unit light-vehicle sales averaged 17.0 million, ahead of the 16.8 million average for the first two months of the fourth quarter, suggesting vehicle sales may be a bit of a drag on overall consumer spending in the final quarter.
…However, Redbook weekly sales estimates suggest a strong holiday gain.
The Johnson Redbook weekly same-store sales index jumped to a 7.9 percent gain from a year ago for the week ended November 29. That is the third-highest result of the current economic expansion, trailing only the 9.3 percent gain recorded for the week of December 28, 2018 and the 8.9 percent rise for the week ended January 4, 2019. Other shopping tracking services have been generally optimistic about the start of the holiday selling season as well.
While these are welcome signs, the early results are not always indicative of the final tally. Shoppers can change the timing of purchases – spending heavily early but then slowing sharply, especially given that there is a shorter shopping period between Thanksgiving and Christmas this year. It’s also possible that consumers maintain or increase spending throughout the period.
Consumer attitudes holding at favorable levels
Consumer attitudes, measured by The Conference Board and the University of Michigan suggest consumers feel pretty good overall. Views on the current environment as well as expectations for the future remain relatively optimistic by historical comparison. While the various measures have fluctuated over the past two years, the levels of the measures of consumer attitudes are broadly trending sideways at a high level.
Various surveys note that the strong labor market is one of the key supports for the positive outlook and that spending is likely to remain solid. Surveys also note the sharp partisan differences among respondents and suggest that political events can have a significant impact in the future. The continued strength of the labor market and outside influences such as the impeachment proceedings and the 2020 presidential election cycle may be critical factors for consumer spending next year.
Trade deficit improving as imports fall more than exports
The U.S. trade deficit shrank to $47.2 billion in October, the lowest since March 2018. On a three-month average basis, the deficit totaled $50.6 billion, the lowest since July 2018. The improvement is a result of a smaller drop in exports relative to imports. Total imports dropped to $254.3 billion in October, down from $258.7 billion in September and $266.8 billion in October 2018, a 4.7 percent decline from a year ago. Total exports were $207.1 billion in October versus $207.6 in September and $210.1 billion in October 2018, a drop 1.4 percent.
Erratic trade policy including on-again, off-again trade negotiations and on-again, off-again tariffs can disrupt supply chains for businesses and alter buying plans for consumers. The elevated degree of uncertainty has the potential to become a significant drag on economic growth.
Federal Reserve balance sheet is growing again
Despite the end of quantitative easing, the Federal Reserve’s balance sheet has started to expand again. As of Wednesday December 4, total assets were $4,066 billion, up from $3,760 billion as of August 29, an increase of $306 billion or an 8.1 percent jump. About $180 billion of the increase is due to additional U.S. Treasury securities held outright. Repurchase agreements have also surged in recent months, totaling more than $200 billion. Holdings of mortgage-backed securities, the other major asset acquired during the implementation of quantitative easing programs, continue to fall.
The changes may be related to normal operations of the Fed and the banking system. While the Fed has been slowly shrinking its assets acquired during and after the financial crisis, the current methods of implementing monetary policy require the Fed to maintain a sizable quantity of assets. To that end, the Fed may be attempting to “right-size” its balance sheet.
Robert Hughes

Robert Hughes joined AIER in 2013 following more than 25 years in economic and financial markets research on Wall Street. Bob was formerly the head of Global Equity Strategy for Brown Brothers Harriman, where he developed equity investment strategy combining top-down macro analysis with bottom-up fundamentals. Prior to BBH, Bob was a Senior Equity Strategist for State Street Global Markets, Senior Economic Strategist with Prudential Equity Group and Senior Economist and Financial Markets Analyst for Citicorp Investment Services. Bob has a MA in economics from Fordham University and a BS in business from Lehigh University.


