CARES Act Stimulus Did Not “Replace Lost Wages”


To explain why the economy collapsed in March and April before recovering vigorously, demand-side economic theorists emphasize excess savings as the cause of the downturn with federal stimulus spending as the driving engine of the subsequent recovery.
An alternative supply-side explanation instead emphasizes the contractionary impact of state lockdowns before late April followed the energizing effect of reopening in more and more states from May through November. However, “the nation’s labor-market recovery stalled in December,” The Wall Street Journal notes, “as a resurgence of. . . state-imposed restrictions” quickly spread to nine states.
The tightening eased a little by January 14, when The New York Times reported that restaurants, bars and most entertainment businesses were completely closed in only four states (CA, OR, NM & IL), though such businesses were partly closed in another thirteen. Also, six states were still under stay-at-home (SAH) orders. That left only 31 states “mostly open” and without SAH restrictions. Predictably, with labor market opportunities closed in 19 states, layoffs are back up. For the week ending January 9, the Journal reported, “the number of workers filing for jobless benefits posted its biggest weekly gain since the pandemic hit last March.”
Meanwhile, Congress passed a scaled-down version of the March 27 CARES Act on December 27. As before, the new law features a mass mailing of “stimulus” checks, extra and extended unemployment benefits, and more forgivable loans (grants) to businesses. As debt-financed payments from the original CARES Act were greatly reduced after July, advocates of “a second stimulus” repeatedly predicted that without another burst of federal transfer payments a double-dip recession is in the cards.
Economists seeing only a stark either/or choice between a second stimulus or a double-dip recession made the headlines every month – July, August, September, October, November and December. These endlessly humiliating predictions of imminent second recessions never made sense unless the first recession had merely been the result of avoidable bungling of fiscal and monetary management rather than the unavoidable intent and result of state lockdowns and SAH orders.
Economists in the Keynesian tradition who emphasize the demand side of economic transactions invariably tend to prescribe policies intended to maximize incentives to spend (“the propensity to consume”), rather than minimize disincentives to produce.
By contrast, Neoclassical economists who focus on the supply side of the economy (incentives or impediments to production), are likely to view the tightening or easing of state restrictions as far more important than, say, an ephemeral windfall of $600 checks.
From a demand-side perspective enlarged and extended unemployment benefits have a magical multiplier effect on nominal demand. From a supply-side perspective, enlarged and extended benefits for being unemployed discourage labor force participation and thus reduce real output. In fact, if governments did manage to stimulate growth nominal GDP (demand) while also restricting real GDP (supply), that policy mix might be a recipe for stagflation.
Economic forecasts (such as last year’s periodic alarms about a double-dip recession) are often visibly affected by assumptions about the relative importance of changes in supply-side restrictions, compared to a supposed boost in consumer spending from new stimulus checks.
If the rebound of 2020 was primarily the result of demand-side “fiscal stimulus” – rather than supply-side reopening – then we need not be too concerned today about how many states lock down businesses or ban inessential jobs. From the demand-side perspective, after all, additional stimulus could supposedly make up for any slowdown due to state restrictions on supply. If millions were prohibited from working but nonetheless had all their wages replaced by government benefits, then negative effects on supply (sources of income) can be easily downplayed by the habitual spotlight on consumer demand (uses of income).
On the other hand, if supply-side restrictions were the main threat last March, and again last December, then “putting more money in people’s pockets” will do nothing to increase the supply of goods and services that stores, restaurants and entertainers are not permitted to sell.
In his year-end Wall Street Journal column, Greg Ip seemed to emphasize the supply-side. He wrote, “the economy’s biggest problem isn’t demand, it is supply. Most Americans have money; they are just constrained in how they spend it because of pandemic-related business restrictions or fears.”
In his previous column however, Ip instead emphasized demand-side stimulus. He highlighted an “unprecedented funnel of federal cash” among “good reasons to think [2021] will be better – perhaps much better – than you think.” He cited an estimate that the new $900 billion stimulus bill will ultimately bring total stimulus since February to $3.5 trillion.” Never mind that only a fourth of that sum will be spent in 2021, or that only 13% of that ($120 billion) is earmarked to replace lost wages of the unemployed. Still, that $3.5 trillion, wrote Ip, “more than replaced all the wage income lost during the pandemic.”
This claim that pandemic-related spending replaced “all the wage income lost” has several problems, not the least of which is that it is not true.
The Table, condensed from the Bureau of Economics (BEA), highlights the largest of what Ip calls stimulus spending but the BEA calls “Pandemic Response Programs”(PRP). All figures show changes in key sources of Personal Income from one month to the next, at annual rates. The BEA began the table with April when “stimulus” spending peaked, so monthly changes start with May.
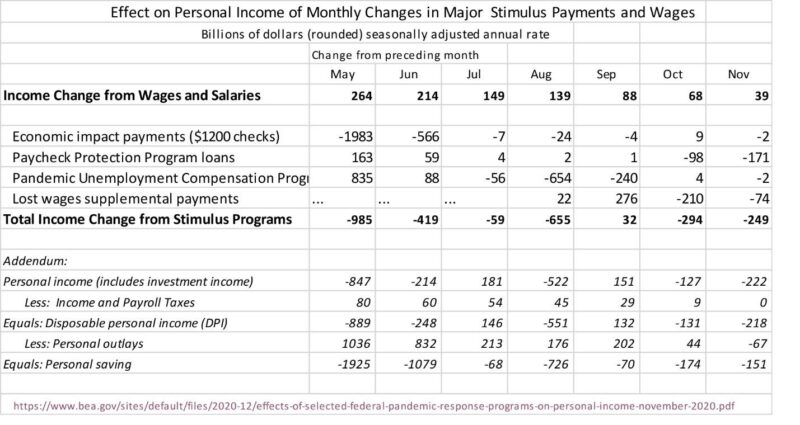
Last April, the first stimulus bill briefly raised personal income lost to an annual rate of nearly $21.1 trillion. By August, personal income had fallen 6.6% to $19.7 trillion. That was not because of “lost wages.” Private wages and salaries rose from $7.2 trillion in April to nearly $8 trillion by August, a gain of 10.4%. Consumer demand [personal outlays] rose most rapidly through August when (1) stimulus payments were falling most rapidly but (2) nearly all major state economies remained relatively open through the fall when some began to limit or reverse the economic reopening of May to July.
Aggregate wage income in the private sector was rising –not falling– long after the stimulus spending peaked in April. Overall losses of wage income only happened in March and April when nearly all states had closed nearly all business except for some the politicians deemed essential (such as Big Box and liquor stores), closed schools, and issued stay-at-home orders to criminalize many jobs. Working in offices was widely banned until at least late April, as was some manufacturing, construction, and travel. Restaurants, entertainment, hair salons and many other service industries were more-or-less shut down in most states until May. In December, they were once again shut down by such economic giants as California (14.7% of U.S. GDP) and Illinois (4.1%).
The alleged demand-side stimulus in the original CARES law was primarily Economic Impact Payments (EIP): direct checks for $3,400 for a family of four (trimmed to $2,400 in the January rerun). These EIP checks added almost $2.6 trillion to annualized personal income in April, $606 billion in May, but only $9 billion by August. The extra $600 of weekly unemployment benefits peaked at an annual rate of $953 billion in June but quickly wound down to only $174.8 billion by August.
For perspective, federal subsidies to business (airlines, hospitals, etc.) increased from an annual rate of $74.5 billion in the first quarter to over $1.2 trillion in the third. That includes PPP loans (usually grants) to small businesses. But PPP loans were the equivalent of only 16% of proprietors’ income at the peak in May and were only intended to delay some layoffs, not to raise wage and salary income by 4.5% that month.
The “stimulus spending” began in earnest around mid-April. But that was also when many states began to reopen their economies, resulting in private wage income rising briskly – to $7,514 billion in May, then $8,185.8 billion by December. Whether the pandemic-related spending plans are labeled “relief” or “stimulus,” neither their front-loaded timing nor Congressional priorities about how the money was spent seemed especially aimed at replacing lost wages.
In two consecutive columns about what happened in 2020, Greg Ip offered two competing narratives. One ascribed the downturn to supply-side restrictions, the other ascribed upturns to demand-side stimulus. If restrictions are shrinking at the same time stimulus is growing, then either of these explanations might appear to fit the facts. The Table, though, shows that is not what happened from May to October. At that time, rolling back the supply-side restrictions produced growing wage income which more than offset the rapidly declining stimulus payments.
Rather than rising stimulus payments offsetting falling wages, as Ip suggests, what happened is that rising wages largely offset the rapid reduction in stimulus payments. The contraction in March-April clearly began with legal restrictions in what products and services certain politically selected businesses were permitted to produce and sell. The subsequent recovery clearly began with the gradual but accelerating easing or removal of those restrictions. Greater sales and employment certainly improved prospective sales of the greater array of products and services available for purchase because of reopening. But to borrow the title of Casey Mulligan’s blog, this was “supply and demand (in that order).”
Far from stimulus checks, PPP loans and jobless benefits “replacing lost wages,” it was instead a swift increase in private wages during the reopening that replaced a swift withdrawal of “fiscal stimulus.”
Alan Reynolds

Economist Alan Reynolds is a senior fellow at the Cato Institute, and former vice president of the First National Bank of Chicago. He served as research director with Jack Kemp’s 1995-96 Tax Reform Commission, and with Larry Kudlow and Alan Greenspan as a member of President Reagan’s 1981 transition team. He is a former columnist with Forbes, Reason, and Creators Syndicate. He is also a past member of the Blue Chip and Wall Street Journal forecasters.
Author of the 2006 book Income and Wealth, Alan Reynolds has written for countless publications since 1971, including the Wall Street Journal, New York Times, Harvard Business Review, The Public Interest, National Review, Regulation and The Cato Journal.