Auto Sales Slowed in December But Remain in Trend

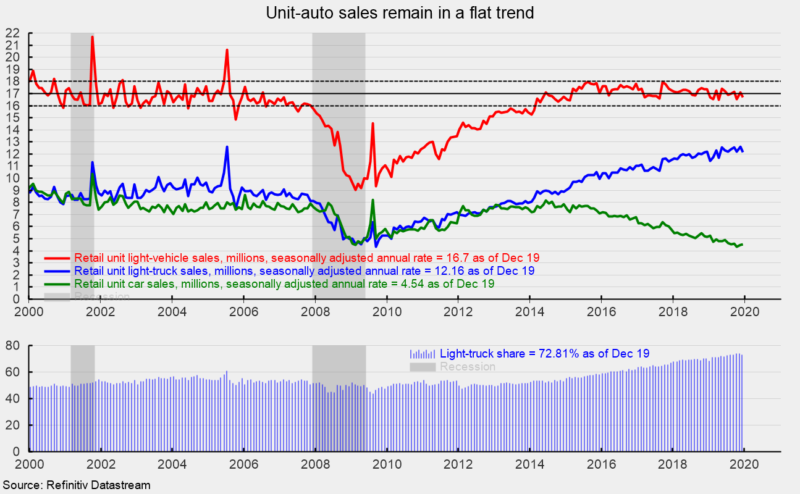
Sales of light vehicles totaled 16.7 million at an annual rate in December, down from a 17.1 million pace in November (see top chart). The pace of sales in December remains well within the 16 to 18 million-unit range that we have seen for much of the past two decades. Unit vehicle sales fell significantly below the range as the 2008–9 recession began, hitting a low of just 9.0 million in February 2009. Sales began a slow recovery and returned to the 16 to 18 million range in March 2014 and have remained there for 70 consecutive months (see top chart).
As of December 2019, light-truck sales totaled 12.2 million at an annual rate while cars managed just 4.5 million. That puts the light-truck share at 72.8 percent, completely dominating the car share of 27.2 percent (see bottom chart). Though the truck share ticked down slightly in December, the share of light trucks remains in an uptrend in place since 2013 (see bottom chart). In February 2013, the split between cars and light trucks (SUVs and pick-up trucks) was about even, with both segments selling about 7.76 million at an annual rate.
Economic data continues to be mixed, with most reports posting erratic gains amid mild positive trends. The labor market remains tight and consumer confidence is holding at favorable levels. While uncertainty around trade is having some impact, there is little hard data to suggest a recession is imminent. The outlook remains cautiously optimistic.


