Are the Conditions Right for Another Commodity Super-Cycle?


Since the price of crude oil and other industrial commodities collapsed and then rebounded in the wake of the Covid pandemic, there has been speculation about the start of a new commodity supercycle. Historically these cycles, sometimes referred to as Kondratieff Waves, are few and far between – on average they occur between 20 and 70 years apart. For more about these long-term waves, The Corporate Finance Institute – What is the Kondratieff Wave? provides an excellent introduction. The inflationary part of these cycles is usually preceded by a period of low capital investment, often the result of listless economic growth, followed by a sudden increase in demand or a supply shock. They end with prices collapsing in what the Austrian economist Joseph Schumpeter described as a period of creative destruction. A period where old methods are replaced by new and innovation sweeps aside inefficient businesses and processes. For further information on this process this MIT Creative Destruction paper is a good primer.
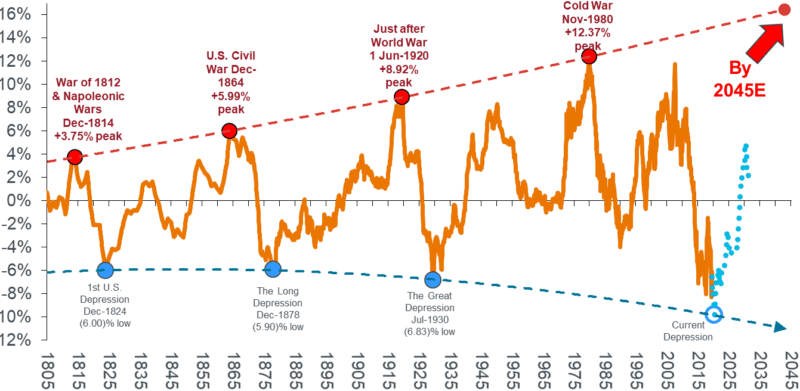
This chart, taken from a recent Janus Henderson article, shows commodity supercycles over the last two centuries: –
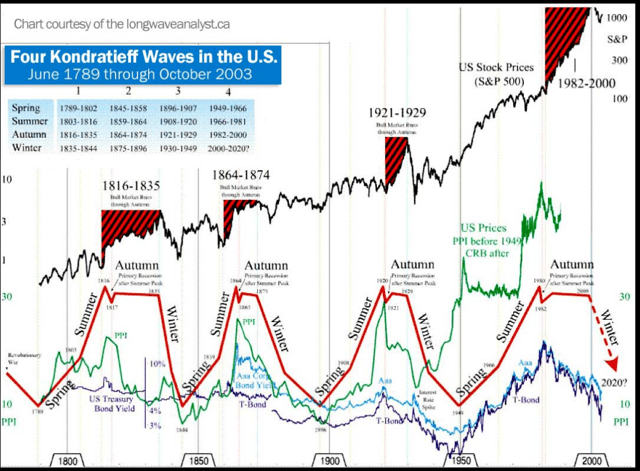
On the basis of the Janus analysis, the boom of 2006-2009 was merely a correction. The Kondratieff presentation below suggests we are twenty years into the Kondratieff Winter; for winter to turn to glorious summer so rapidly would indeed be unusual: –
As economies have moved away from a reliance on basic materials and manufacturing, the patterns of the long economic waves, historically tied to the fortunes of commodity prices, have weakened. The processes of creative destruction have also been frustrated by the financial repression of developed – and to a lesser extent developing – nations and their notionally independent central banks. Nonetheless, commodity prices often trend and the cause of those trends is always an imbalance in supply or demand.
From a demand perspective this chart highlights the correlation between commodity prices and fiscal spending on Social Security: –
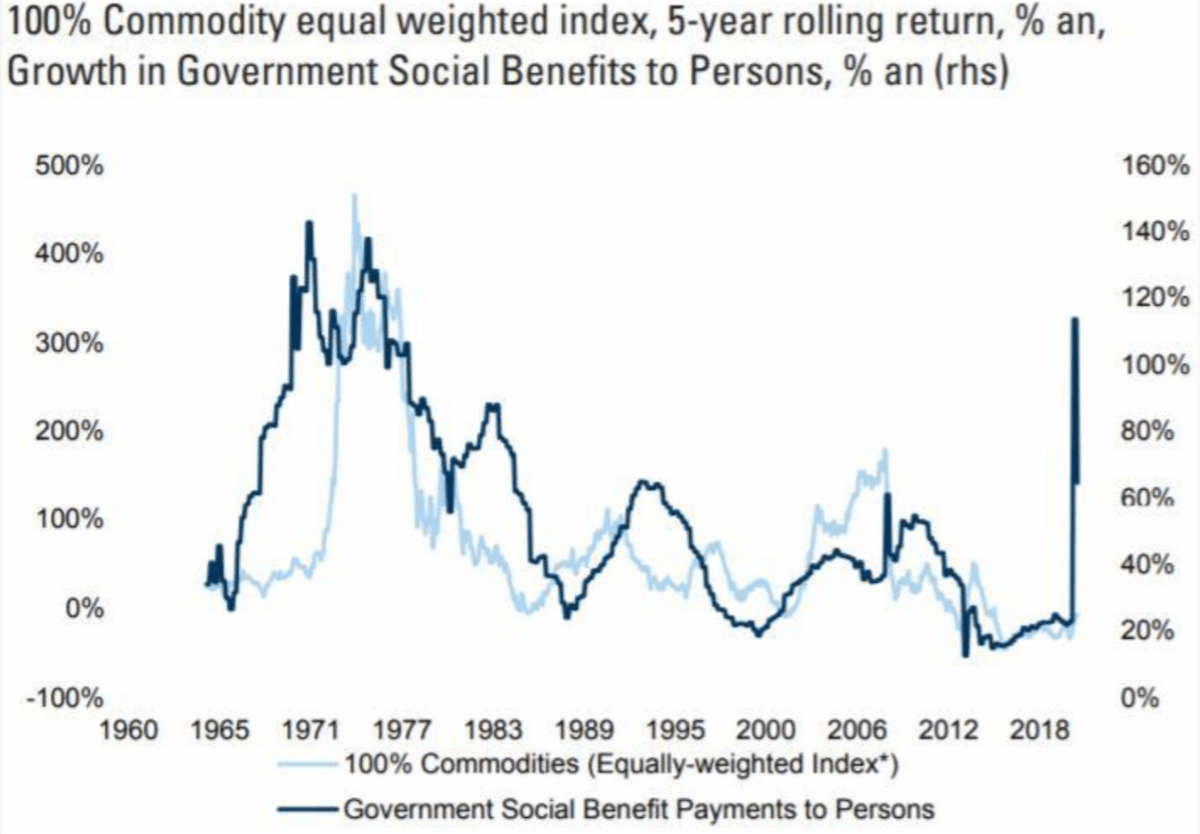
When one adds in the effect that fiscal spending will have on demand for industrial commodities for infrastructure projects and housing the expectation of increased demand looks compelling.
Another reason commodities may be set to rise is their valuation relative to stocks: –
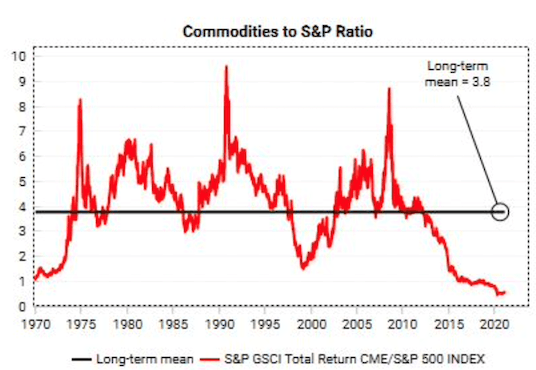
Commodity prices may have bottomed in Q2, 2020 but their rebound has still lagged a breathtakingly ebullient stock market.
Of course, thanks to human ingenuity, in inflation adjusted terms, the price of commodities has been falling for millennia. This chart shows the Economist Industrial Price Index adjusted for inflation using the US GDP Deflator: –
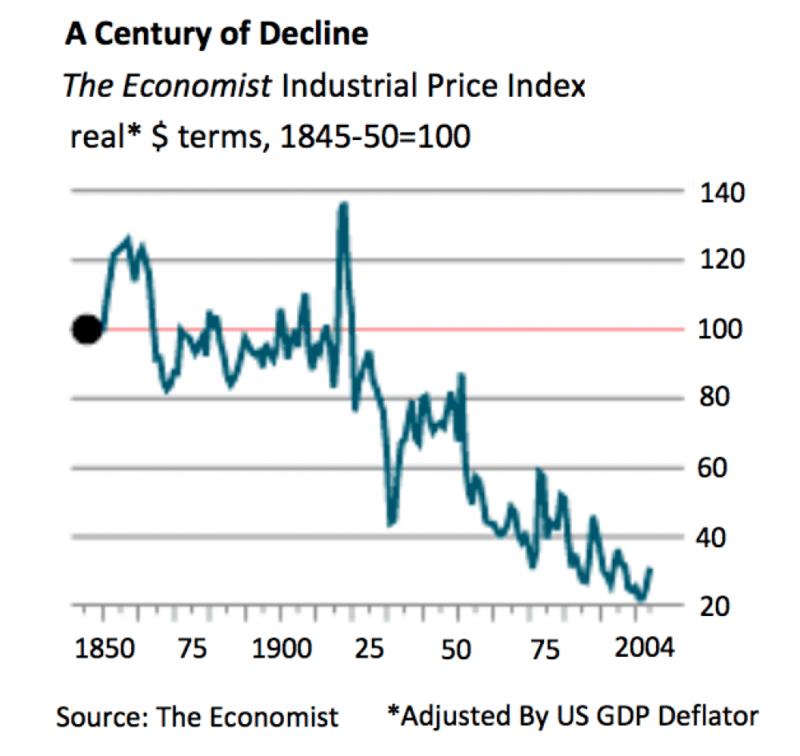
Supply and demand shocks are still evident starting with the buildup to the US Civil War of 1861-1865. The swings have moderated since the ending of the Bretton Woods agreement; however we may be in for a shock. According to the World Bank June 2020 – Global Economic Prospects report, the current pandemic has seen the largest decline in per capita output since 1870 and the largest recession since WWII.
I used to think that if there was reincarnation, I wanted to come back as the president or the pope or as a .400 baseball hitter. But now I would like to come back as the bond market. You can intimidate everybody.
James Carville – Political adviser to President Clinton
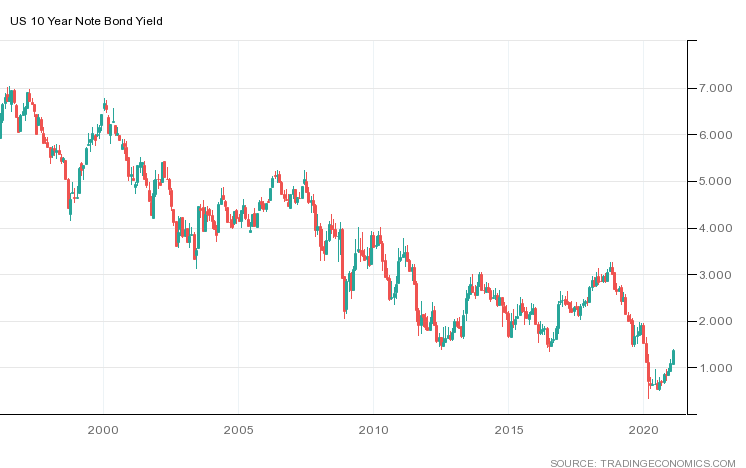
Rising commodity prices often feed through to consumer price increases and the US bond market has taken note. Having reached an all-time low of 0.32% in March 2020, 10yr Treasury yields have rebounded to reach almost 1.4% this week (w/c 22nd February). The chart below shows how bond yields have declined over the last 25 years: –
The Federal Reserve may be more tolerant of higher inflation in the short run in order to achieve their 2% target over the long run, but the bond market looks determined to call their bluff. Yet the collective memory of the bond market is short; between 1942 and 1950 US Treasury yields were fixed. This Federal Reserve article – How the Fed Managed the Treasury Yield Curve in the 1940s – explains: –
By mid-1942 the Treasury yield curve was fixed for the duration of the war, anchored at the front end with a ⅜ percent bill rate and at the long end with a 2½ percent long-bond rate. Intermediate yields included ⅞ percent on 1-year issues, 2 percent on 10-year issues, and 2¼ percent on 16-year issues…
In late November 1950, facing the prospect of another major war, the Fed, for the first time, sought to free itself from its commitment to keep long-term Treasury yields below 2½ percent. At the same time, Secretary of the Treasury John Snyder and President Truman sought a reaffirmation of the Fed’s commitment to the 2½ percent ceiling.
During the same period US consumer price inflation was allowed to fluctuate considerably: –
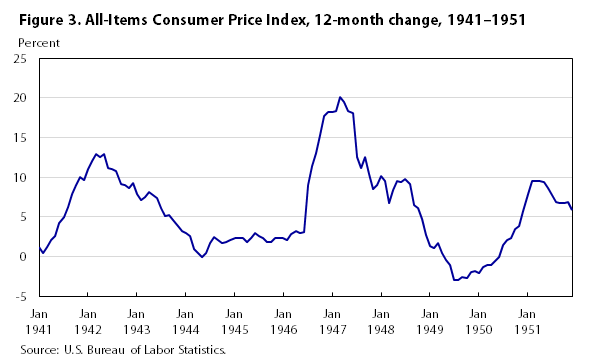
The Federal Reserve of the Forties was still an ingénue, and their dual mandate of full employment and stable prices was only introduced in 1977. Nonetheless, with yield-curve control they effectively neutered the bond market. If bond yields cannot rise, stocks remain underpinned; only the currency is left to take the strain. Yet, if all major fiat currencies are engaged in a race to debase, the environment looks more like one where stores of value, such as gold and other commodities, will be favoured, as central bank balance sheets balloon.
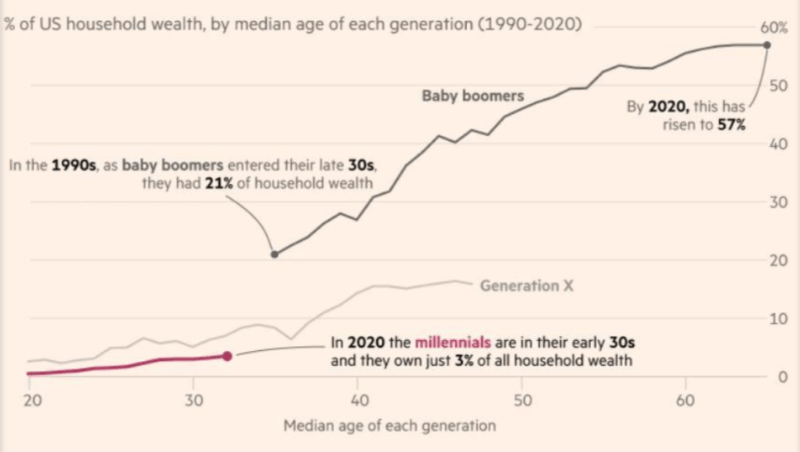
On the fiscal side of the equation, those individuals with savings favour less financial repression; those with debt, the opposite. The next chart shows US wealth by generational cohort. Back in the early 1990’s, when the Boomers were the same age that Millennials are today, their share of US household wealth was 21%, while today Millennials account for just 3%. Generation X shows a possible Millennial trajectory; already in their late 40’s they account for just 17%. By that age the Boomers had accumulated more than 40% of the total: –
This wealth distribution is important because the Millennials will shortly gain the upper-hand in terms of votes: –
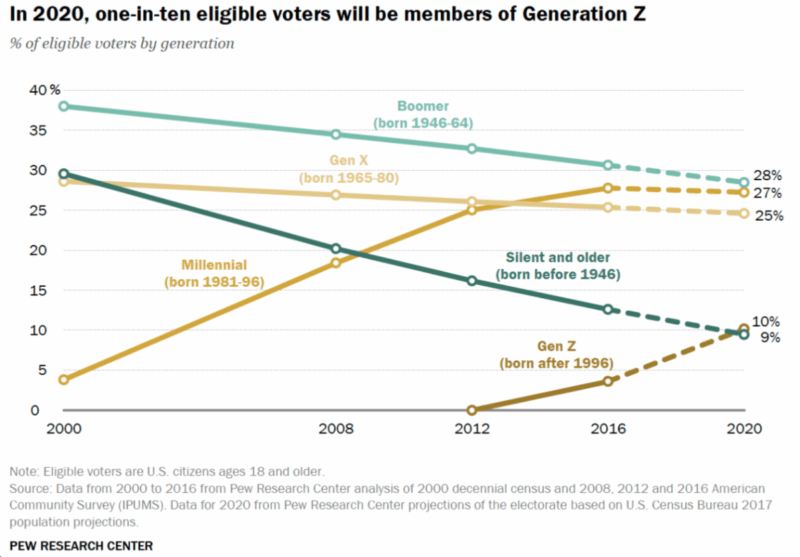
Millennials and Generation Z already account for 37% of votes. The weakening of the financial position of Generation X resulting from the pandemic will further tip the scales in favour of fiscal expansion, at least until employment has been restored to pre-Covid levels.
As for where the governments will focus their fiscal largesse? It will undoubtedly be directed to those in greatest need. The initial post-Covid financial stimulus benefited higher-income groups but their marginal propensity to consume out of wealth is meagre – Goldman Sachs’ recent estimate put it at just 3%. As election promises are kept, US government aid will be directed to lower income groups. Here is an estimate of how $1 of fiscal spending will affect commodity prices as it applies to each income decile: –
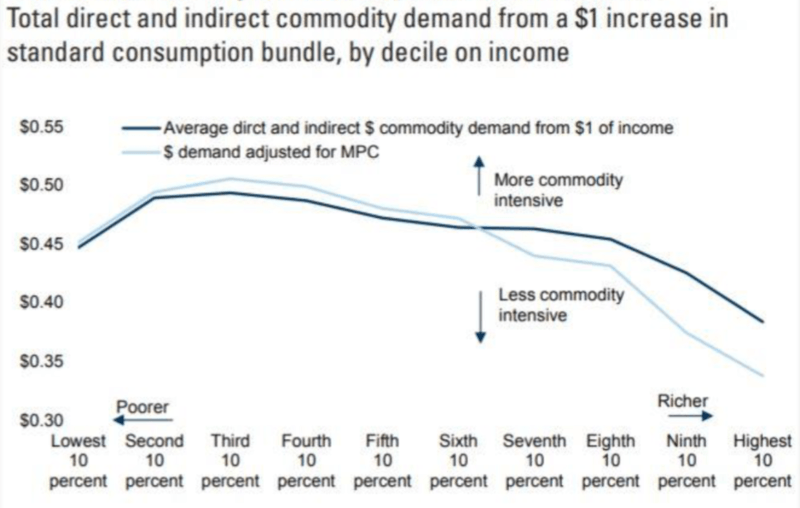
Redistribution policies are traditionally commodity-price-positive since lower-income households tend to spend more of the extra money they receive.
President Biden is about to roll out $1.9trln of additional spending measures and has indicated that further spending on infrastructure, climate change, education, digital transformation and healthcare could be undertaken should this jab in the economic arm not suffice. Taken together the measures could be worth 9% of US GDP. For those wondering (or worrying) about the efficacy and true cost of these measures this article from the Peterson Institute – In defense of concerns over the $1.9 trillion relief plan provides insight. Of more importance to the discussion of commodity prices is the question of which commodities will be in the vanguard and which might not be impacted at all. To that end according to last month’s US Manufacturing Purchasing Manager’s Report only Caustic Soda fell in price. Commodities in short supply included Copper; Corrugate; Corrugated Boxes; Electrical Components; Electronic Components; Road Freight; Personal Protective Equipment; Semiconductors; Cold Rolled, Hot Rolled and Fabricated Steel.
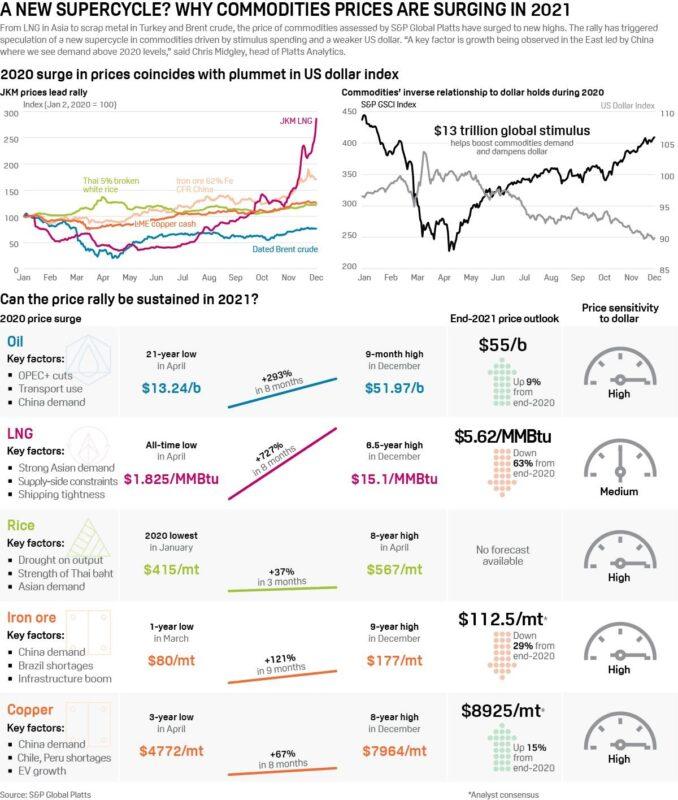
The recovery from this pandemic will emphasise the renewable industrial revolution and social need. China recently committed to carbon neutrality by 2060, and President Biden has already returned the US to the Paris Agreement on climate change. Energy policy is going green and global, and it has the potential to create a new cycle of capital expenditure favouring commodities needed to accelerate climate-friendly technology. By way of example, last year the price of silver rose by almost 48%; this infographic shows the breakdown of demand: –
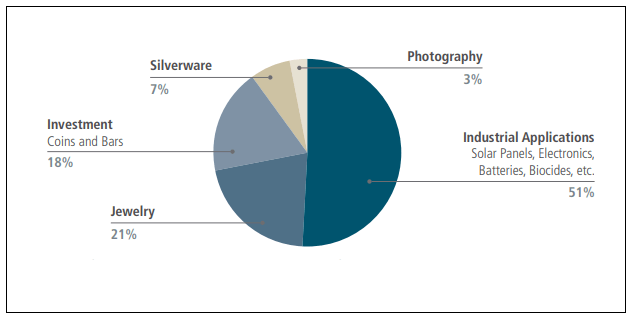
The industrial applications are key to the growth in demand. Silver will benefit from an expanding automotive sector, especially for electric vehicles; solar energy is also a driver of demand as is the growth of 5G broadband.
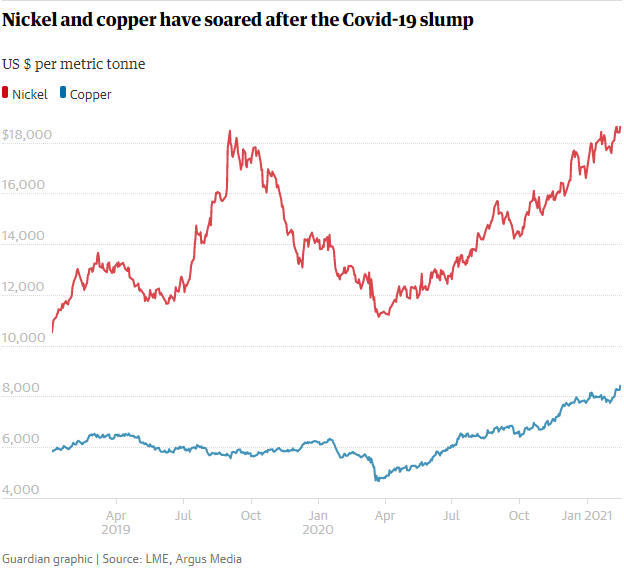
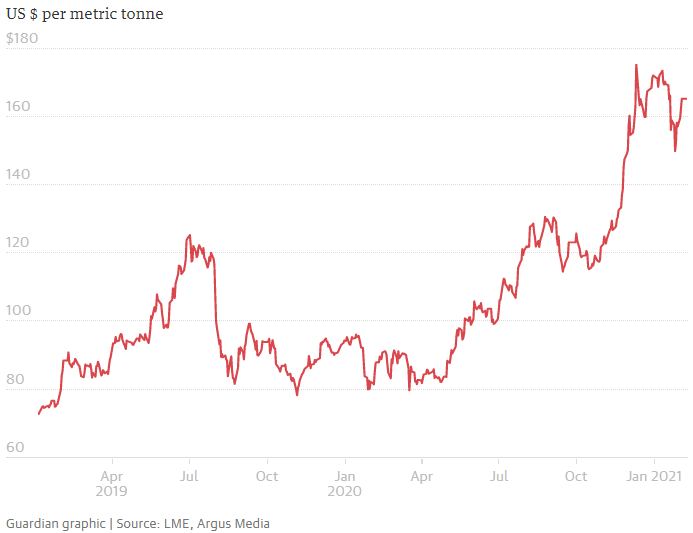
This week copper, a bellwether of industrial metals, hit a nine-year high at more than $9,000/ton, whilst nickel breached $21,000/ton, its highest since 2014. The chart below is to mid-January: –
Price increases are not confined solely to the elements of the green revolution; witness the recent surge in iron ore, possibly driven by the rebound in the Chinese economy after their strong monetary stimulus in the aftermath of the pandemic: –
It is not just commodities that will be affected by this demand-pull; the impetus will have a multiplier effect on labour markets and commodity-producing countries. There will be bottlenecks caused by the decade-long shortening of supply chains; trade tensions have not vanished with the outgoing US President. Meanwhile China has continued to strengthen its grip on the supply of rare-earth metals, yet it imported a record 71,407 tons of rare-earth ores from the US last year, up 55% from 2019, for which they paid 26% more.
Agriculture, Energy and Freight
Commodities, although invariably lumped together from an investment perspective, are the most diverse instruments to trade, and their prices can vary widely depending on many differing factors. Within the agricultural sector there has been much dispersion: –
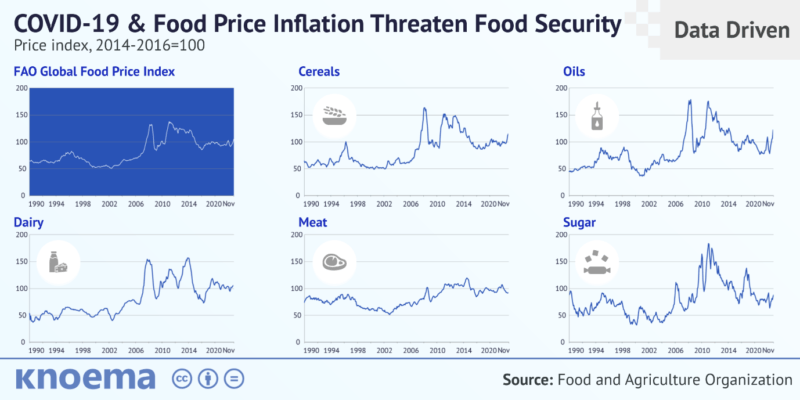
There may be flash points which drive individual agricultural commodity prices higher but overall the price increases have been moderate.
Currently crude oil and natural gas prices are on the rise. An unseasonably cold snap has hit the US, especially Texas, which has reduced the ability to use wind power and reduced well capacity just as domestic demand has risen. The chart below shows prices over the last five years: –
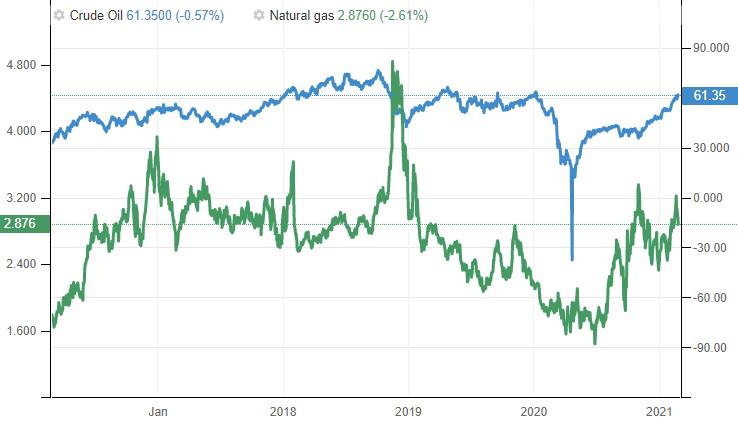
Aside from the liquid natural gas demand, which is high due to unseasonably cold weather in Asia, the gas market seems to be relatively stable.
The picture looks reasonably balanced for oil too, until one looks at the rig count data for the world’s largest oil producer, the US: –
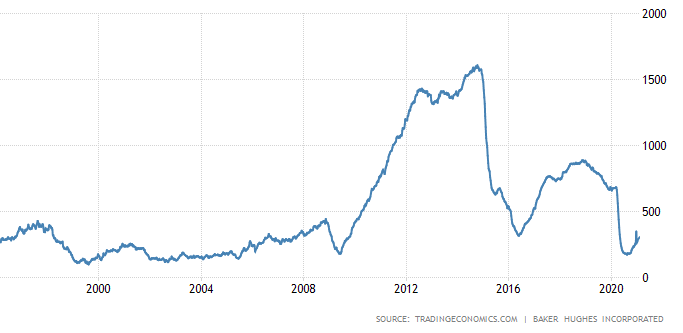
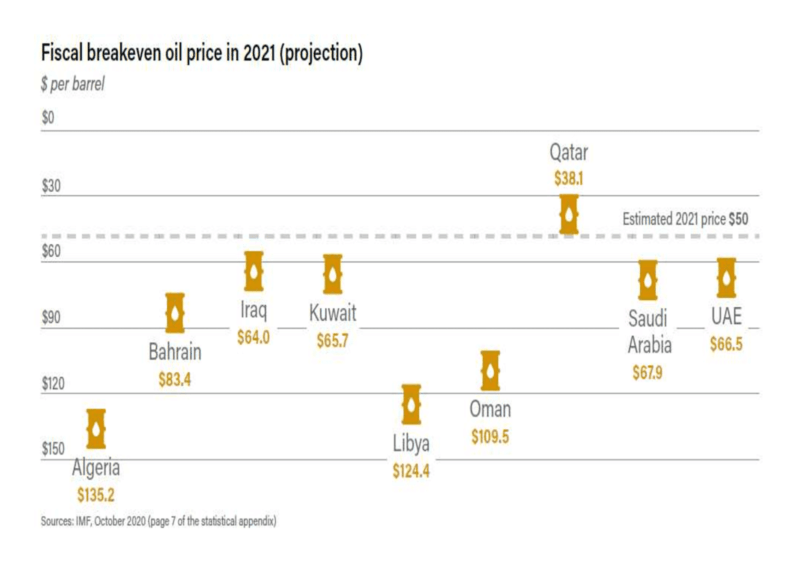
The fiscal break-even for the largest oil producers outside the US means substantially higher crude oil prices are needed in order to balance fiscal budgets. It should also be remembered that many of these countries lack the political stability of developed nations: –
The geopolitics of energy is always dangerous to underestimate. Europe, which relies on Russia for 40% of its gas imports and 30% percent of oil imports, is just one example of the upside risk evident in many natural resources.
No review of commodity prices is complete without considering shipping, for without ships, commodities cannot be transported.
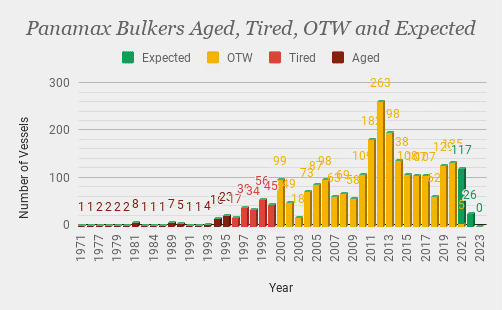
In the Dry Freight market the pandemic caused rates to collapse, and ship owners responded by increasing scrapping whilst maintaining relatively low new-build orders. Many previous orders had already been delivered just in time for the Covid crisis to strike. Looking at the three main cargo ship types we see the same pattern, which suggests there will be a shortage of capacity. Here is the situation in the Panamax market but the pattern holds true for Capesize and Supramax vessels as well: –
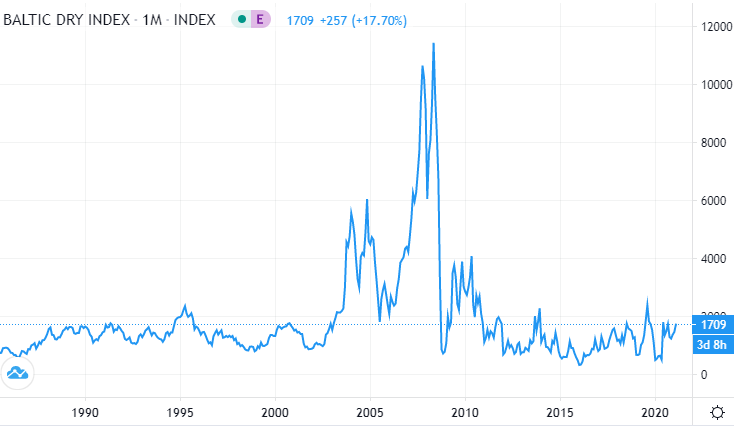
To date this supply shortage has only led to a small increase in the Baltic Dry Freight Index. Here is a chart showing just how inelastic prices can become: –
Container shipping rates have also been rising and shipping specialists suggest supply bottlenecks will not ease until 2025 at the earliest. A dearth of supply and long lead time between ordering a new ship and its delivery underpin freight rates. Even a moderate increase in demand could herald a 2007/2008 reprise.
Conclusion
At the beginning of January Goldman Sachs released a client report predicting a new commodity supercycle. They see rising wages leading to faster, commodity price positive, home formation and more synchronised social policies, akin to those of the 1960s ‘War on Poverty’ campaign. In other respects they believe this cycle has stronger parallels to the 1970s than the 2000s. Goldman expects industrial capex to run at 2000 levels whilst social rebuilding generates a 1970s-style consumer boom.
This infographic from S&P is also useful when considering the potential winners and losers: –
With unemployment rates still elevated and much of the global economy in some form of lockdown, it is hard to imagine the conditions for an economic boom, especially one that will see wage increases, but the size and scale of the global monetary and fiscal response to the pandemic is unprecedented. It creates the conditions for a continued appreciation of a wide range of essential commodity prices as the pandemic ends and demand rebounds.
Colin Lloyd

Colin is a macroeconomic commentator, writer and presenter, based in London, England. He has worked for asset managers in commodities, money markets, capital markets, equities and foreign exchange since the early 1980’s and writes In the Long Run. He is a contributor to several free-market publications including The Cobden Centre and was a 2017 runner-up for the 2017 Richard Koch Breakthrough Prize awarded by The Institute of Economic Affairs.