AIER Leading Indicators Index Moves Higher in February

Summary
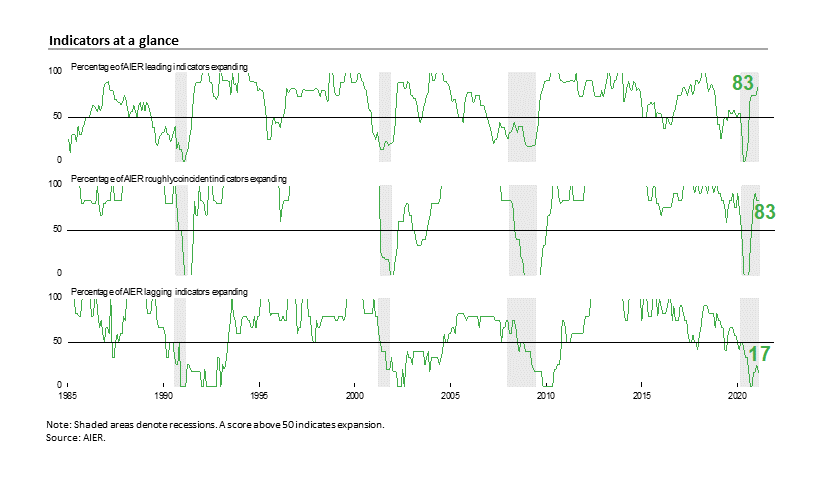
AIER’s Leading Indicators Index posted a gain in February, hitting the highest level since October 2018. The Leading Indicators index came in at 83 following four consecutive months at 75. The February result marks the sixth consecutive month above the neutral 50 level. The Roughly Coincident Indicators index held at 83 for a second month after posting a 92 in December while the Lagging Indicators Index fell back to 17 from 25 (see chart). The results indicate economic growth broadened modestly in February and suggest continued economic expansion in the months ahead.
Economic data over the past month continue to show varied strength among the major sectors of the economy. Housing remains robust, with ongoing gains and multi-year highs in levels of activity. Manufacturing is also performing admirably though levels of activity generally remain below pre-pandemic levels. However, both are facing some headwinds: rising home prices and mortgage rates in housing, and labor issues, new health procedures, supply constraints, and logistical issues in manufacturing. Business investment had a strong fourth quarter while consumer spending finished the year with disappointing results (though retail sales rebounded sharply in January).
The labor market represents an intersection for businesses and consumers and is critical to the economic outlook. Jobs gains and income growth have been mixed recently as government restrictions on consumers and businesses remain a significant threat to the outlook. The distribution of vaccines is a very positive development for the outlook and should eventually lead to the cessation of restrictive policies. In the meantime, the longer the virus continues to spread (along with the possibility of mutations prolonging the outbreak), consumers remain restricted, and businesses remain closed or limited, the more uncertain a labor market recovery becomes and the higher the probability of financial hardships contributing to a slow and drawn-out economic recovery.
Leading Indicators index hits the highest level since October 2018
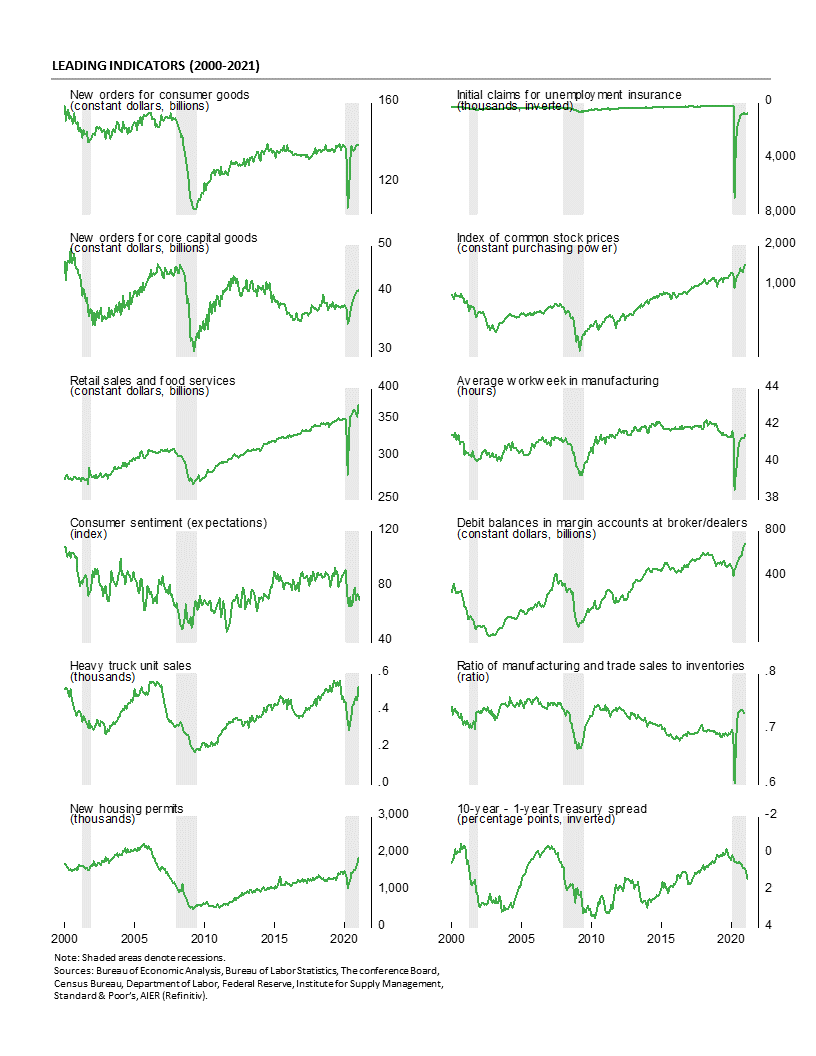
The AIER Leading Indicators index rose to 83 in February, the highest level since October 2018. The February result is the sixth month in a row above the neutral 50 threshold and follows a run of four consecutive months at 75. The results indicate that favorable trends have broadened among the 12 leading indicators and suggest continued overall economic expansion. In total, 10 of the 12 leading indicators were in a positive trend in February, with 2 trending lower and none were neutral.
Initial claims for unemployment benefits was the lone change among the leading indicators, moving from an unfavorable trend in January to a favorable trend in February. The other labor-related leading indicator, the average workweek in manufacturing, remained in a favorable trend in February. Positive (favorable) trends also continued for real retail sales and food services, real new orders for core capital goods, real new orders for consumer goods, total heavy-truck unit sales, the ratio of manufacturing and trade sales to inventory, housing permits, debit balances in customers’ margin accounts, and real stock prices. Downward (unfavorable) trends remained in place for the University of Michigan index of consumer expectations and the 10-year–1-year Treasury yield spread.
Overall, the Leading Indicators index moved further above the neutral 50 level to a multiyear high, indicating widening breadth among the 12 indicators and suggesting continued expansion is likely. However, government policies continue to distort economic activity and threaten future growth. The distribution of vaccines is a positive development for the outlook and should eventually lead to the cessation of restrictive policies.
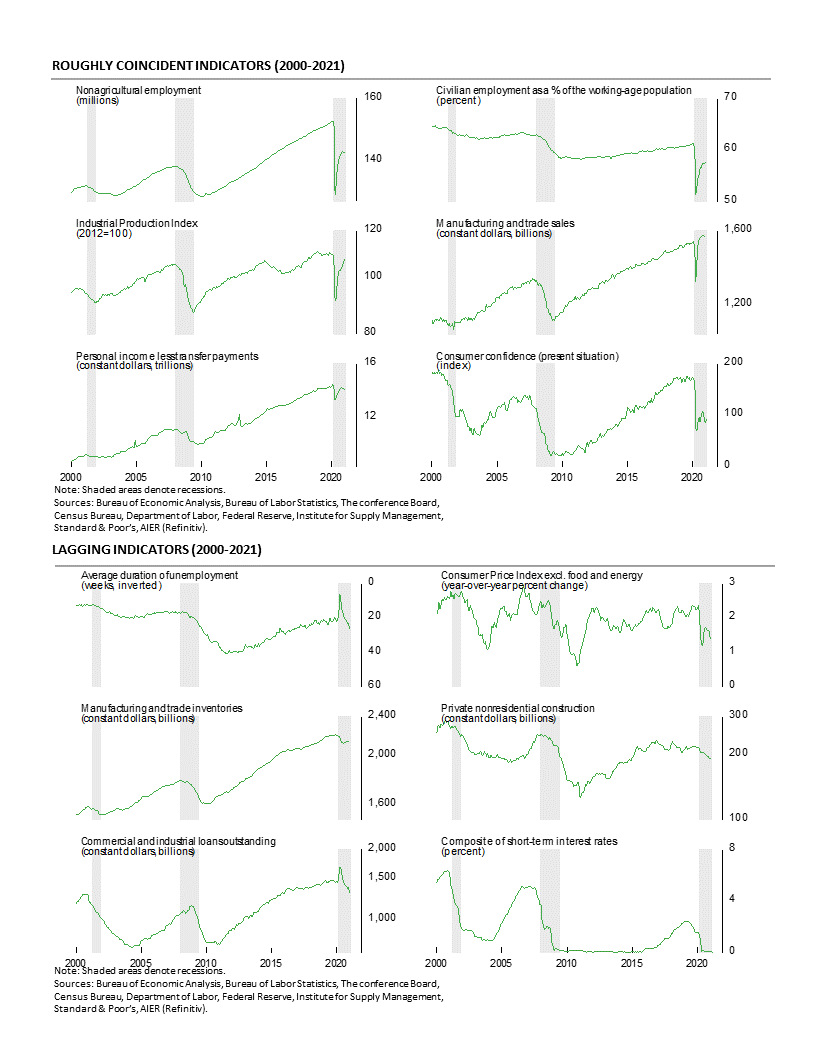
The Roughly Coincident Indicators index remained unchanged in February, coming in at 83 for a second consecutive month, following a 92 reading in December. This index rose rapidly from a zero reading in August to 83 in November. The six individual roughly coincident indicators were all unchanged in February with five indicators trending favorably while one was in an unfavorable trend and none were in a neutral trend.
AIER’s Lagging Indicators index fell back to a reading of 17 in February following a 25 result in January, back-to-back readings of 17 in November and December, and back-to-back zeros in September and October. Just one indicator changed trend in the latest month: the 12-month percent change in the core consumer price index (consumer price index excluding food and energy) weakening from a neutral trend to an unfavorable trend. Overall, five indicators were trending lower, one indicator was trending higher, and none were in a neutral trend.
Initial Claims Fall to the Lowest Level Since November
Initial claims for regular state unemployment insurance totaled 730,000 for the week ending February 20, down 111,000 from the previous week’s downwardly revised tally of 841,000. The latest week is the lowest level since November 28 and follows a run of six consecutive weeks above the 800,000 level. Initial claims have continued to run in the 700,000 to 1 million range for 26 consecutive weeks and remain well above the pre-pandemic level of 212,000 in early 2020.
The four-week average fell 20,500 to 807,750, the third weekly decline in a row. However, the four-week average has been above the 800,000 level for 11 consecutive weeks. The latest result is a positive sign but persistent initial claims at such a historically high level remain a threat for the labor market recovery and the economy.
The number of ongoing claims for state unemployment programs totaled 4.934 million for the week ending February 6, down 68,890 from the prior week. State programs had been trending lower since early March, but the downward trend has turned to a flattish trend since the week ending November 21, decreasing by an average of just 25,408 or 0.4 percent per week over the past 11 weeks. For the same week in 2019, ongoing claims were 2.095 million.
Continuing claims in all federal programs rose again in the latest week, coming in at 14.108 million for the week ending February 6. Since the beginning of June 2020, continuing claims in all Federal programs have averaged 14.051 million.
The total number of people claiming benefits in all unemployment programs including all emergency programs was 19.043 million for the week ended February 6, up 701,102 from the prior week.
Weak January Jobs Report Boosts Labor Market Concerns
U.S. nonfarm payrolls added just 49,000 jobs in January, after a drop of 227,000 in December (December was the first monthly decline since the historic, shutdown-driven plunges in March and April). The gain brings the nine-month post-plunge recovery to 12.47 million and is far from offsetting the 22.36 million loss in March and April, leaving nonfarm payrolls 9.9 million or 6.5 percent below the February 2020 peak.
Private payrolls rose by a very disappointing 6,000 jobs in January, which brings the nine-month recovery to 12.79 million versus a loss of 21.35 million in March and April, leaving private payrolls 8.6 million or 6.6 percent below the February 2020 peak.
The details of the report are worrisome, with a clear deterioration in the breadth of gains over the last five months. While August showed gains for nearly every industry, subsequent months have shown few gains and more declines. Overall, the report suggests that the payroll recoveries of many industries within the economy are faltering. The uneven performance of the different industries particularly as large gaps to full recovery persist is raising doubts about the strength and durability of the recovery.
Within the 6,000 gain in private payrolls, private services added 10,000 while goods-producing industries lost 4,000. For private service-producing industries, the gains were led by a 97,000 rise in business and professional services and a 34,000 rise in education services. Offsetting those gains were a 61,000 decline in leisure and hospitality, a 41,000 drop in health care and social assistance, a loss of 38,000 in retail, and a 28,000 fall in transportation and warehousing.
Within the 4,000 drop in goods-producing industries, construction lost 3,000 jobs, durable-goods manufacturing decreased by 17,000, nondurable-goods manufacturing rose by 7,000, and mining and logging industries added 9,000 jobs.
Eleven months after the peak in employment, every private industry group still has fewer employees. The net losses range from about 8,300 in utilities workers to a devastating 3.9 million in leisure and hospitality.
On a percentage basis, the losses are more evenly distributed. Leisure and hospitality still leads with a 22.9 percent drop since February. However, mining and logging comes in second with an 11.7 percent loss followed by education services at 11.3 percent and information services at 8.3 percent. Seven of the 14 private industries shown in the report have declines of four percent or more since February 2020.
The government sector added 43,000 employees in January, with local government payrolls rising by 36,000, state government payrolls up 31,000, but the federal government cutting 24,000 workers.
Average hourly earnings rose 0.2 percent in January, putting the 12-month gain at 5.4 percent. The average hourly earnings data should be interpreted cautiously, as the concentration of job losses for lower-paying jobs during the pandemic distorts the aggregate number.
The average workweek increased in January, rising 0.3 hours to 35.0 hours. Combining payrolls with hourly earnings and hours worked, the index of aggregate weekly payrolls rose 1.1 percent in January following a 0.5 percent gain in December. The index is up 0.6 percent from a year ago.
The total number of officially unemployed fell to 10.130 million in January, a drop of 606,000 from December. The number of officially unemployed in January 2020 was just 5.796 million.
The unemployment rate fell to 6.3 percent while the underemployed rate, referred to as the U-6 rate, fell from 11.7 percent in December to 11.1 in January.
The participation rate also fell in January, dropping to 61.4 percent; the participation rate was 63.4 percent in January 2020. The employment-to-population ratio, one of AIER’s Roughly Coincident indicators came in at 57.5 for January, above the 57.4 ratio in December.
Government Transfer Payments Distort Personal Income in January
Personal income jumped 10.0 percent in January, boosted primarily by a 52.0 percent surge in personal transfer payments, according to data from the Bureau of Economic Analysis. Personal income data over the past eleven months have been sharply distorted by lockdown policies which caused massive layoffs, and government stimulus programs that sent transfer payments skyrocketing. Ultimately, a strong, self-sustaining economy without government distortions is likely to provide the most beneficial future.
Excluding personal transfer payments, personal income fell 0.1 percent in January and is down 0.6 percent over the latest 12-month period. In real terms (adjusting for price changes), personal income excluding transfers fell 0.5 percent in January, leaving that measure down 2.0 percent for the year. Both measures remain below their pre-pandemic levels.
Personal tax payments fell 0.4 percent in January, leaving disposable personal income with an 11.4 percent jump for the month. Adjusted for price changes, real disposable income rose 11.0 percent in January.
Among the other components of personal income, wages and salaries, which typically account for about half of personal income, rose 0.7 percent for the month while supplements to wages and salaries (primarily employer contributions to pension and insurance funds and government social-insurance programs) which typically account for another 12 percent of personal income also posted a gain, rising 0.8 percent. Proprietors’ income fell 0.5 percent for the month following drops of 4.6 percent in December and 10.4 percent in November. Income on assets (interest and dividends) also fell, dropping 3.0 percent in the latest month.
Job Openings Increase in December, But Labor Questions Remain
The latest Job Openings and Labor Turnover Survey from the Bureau of Labor Statistics shows the total number of job openings in the economy rose to 6.646 million in December, up from 6.572 million in November. The number of open positions in the private sector increased to 6.048 million in December. Private-sector openings are well above the low of 4.332 million in April at the height of government-imposed lockdowns, posting gains in six of the last eight months, but are still below the pre-pandemic peak of 6.858 million in November 2018. The private-sector job-openings rate, openings divided by the sum of jobs and openings, was 4.8 percent, up from 4.6 percent in November and well above the low of 3.8 percent in April.
The industries with the largest number of openings were professional and business services (1.523 million), education and health care (1.247 million), and trade, transportation, and utilities (1.229 million). The highest openings rates were in professional and business services (6.9 percent), leisure and hospitality (5.5 percent), and education and health care (5.1 percent).
The rise in job openings was a function of hires, separations and changing labor requirements. Hires in December fell to 5.539 million from 5.935 million in November. At the same time, the number of separations fell to 5.460 million in December with the number of private sector separations increasing to 5.130 million. Within separations, total quits were 3.286 million (versus 3.180 million in November) and layoffs were 1.812 million, down from 2.055 million in the prior month.
The total separations rate fell to 3.8 percent with the private sector experiencing a rate of 4.2 percent, unchanged from November. By industry, leisure and hospitality leads with a separations rate of 9.0 percent (layoffs rate of 3.9 percent and quits rate of 4.9 percent.
From the worker perspective, labor market conditions remain challenging. The number of openings per job seeker (unemployed plus those not in the labor force but who want a job) fell to a modest 0.342. That is well below the 0.72 openings per seeker in November 2019 but well above the low of 0.101 in December 2009.
Outlook remains cautiously optimistic
Overall, the economy continues to recover from the draconian lockdowns that began in 2020 though the results vary widely among the different sectors. The AIER Leading Indicators index indicates growth broadened among the 12 individual leading indicators and suggests continued expansion in coming months.
However, government restrictions on consumers and businesses remain a significant threat to the outlook for economic growth. The distribution of vaccines is a very positive development and should eventually lead to sharply less government restrictions. In the meantime, the longer the virus continues to spread (along with the possibility of mutations prolonging the outbreak), consumers remain restricted, and businesses remain closed or limited, the more uncertain a labor market recovery becomes and the higher the probability of a slow and drawn-out economic recovery.
Robert Hughes

Robert Hughes joined AIER in 2013 following more than 25 years in economic and financial markets research on Wall Street. Bob was formerly the head of Global Equity Strategy for Brown Brothers Harriman, where he developed equity investment strategy combining top-down macro analysis with bottom-up fundamentals. Prior to BBH, Bob was a Senior Equity Strategist for State Street Global Markets, Senior Economic Strategist with Prudential Equity Group and Senior Economist and Financial Markets Analyst for Citicorp Investment Services. Bob has a MA in economics from Fordham University and a BS in business from Lehigh University.


